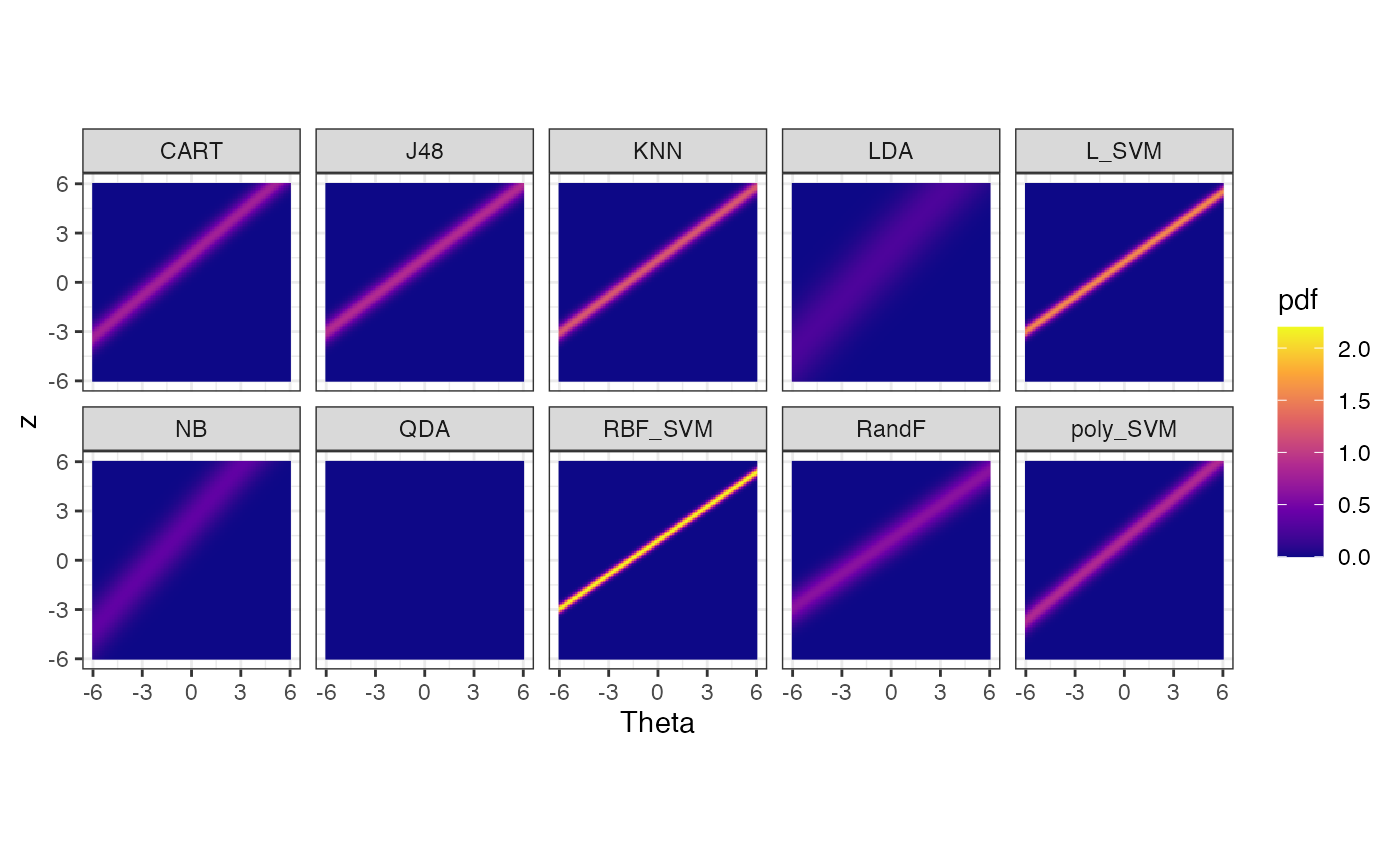
Function to produce heatmaps from a continuous IRTmodel
heatmaps_crm.RdThis function makes a dataframe from the continuous IRTmodel the autoplot function produces the heatmaps.
Arguments
- model
Output from the function
cirtmodel.- thetarange
The range for
theta, default from -6 to 6.- object
For autoplot: output of heatmaps_crm function.
- xlab
For autoplot: xlabel.
- nrow
For autoplot: number of rows of heatmaps to plot.
- ratio
For autoplot: ratio for coord_fixed in ggplot.
- col_scheme
For autoplot: the color scheme for heatmaps. Default value is plasma.
- ...
Other arguments currently ignored.
Value
Dataframe with output probabilities from the IRT model for all algorithms, an object of class heatmapcrm.
Examples
data(classification_cts)
model <- cirtmodel(classification_cts)
#> Warning: NaNs produced
obj <- heatmaps_crm(model)
head(obj$df)
#>   theta  z        pdf Algorithm
#> 1  -6.0 -6 0.08811672        NB
#> 2  -5.9 -6 0.07304618        NB
#> 3  -5.8 -6 0.05987444        NB
#> 4  -5.7 -6 0.04852775        NB
#> 5  -5.6 -6 0.03889051        NB
#> 6  -5.5 -6 0.03081782        NB
autoplot(obj)