Computes a set of basis vectors for outlier detection.
dobin.RdThis function computes a set of basis vectors suitable for outlier detection.
dobin(xx, frac = 0.95, norm = 1, k = NULL)Arguments
- xx
The input data in a dataframe, matrix or tibble format.
- frac
The cut-off quantile for
Yspace. Default is0.95.- norm
The normalization technique. Default is Min-Max, which normalizes each column to values between 0 and 1.
norm = 0skips normalization. Other values of norm defaults to Median-IQR normalization.- k
Parameter
kfor k nearest neighbours with a default value of5%of the number of observations with a cap of 20.
Value
A list with the following components:
rotationThe basis vectors suitable for outlier detection.
coordsThe dobin coordinates of the data
xx.YspaceThe The associated
Yspace.YpairsThe pairs in
xxused to construct theYspace.zerosdcolsColumns in
xxwith zero standard deviation. This is computed only if the number of columns are greater than the number of rows.
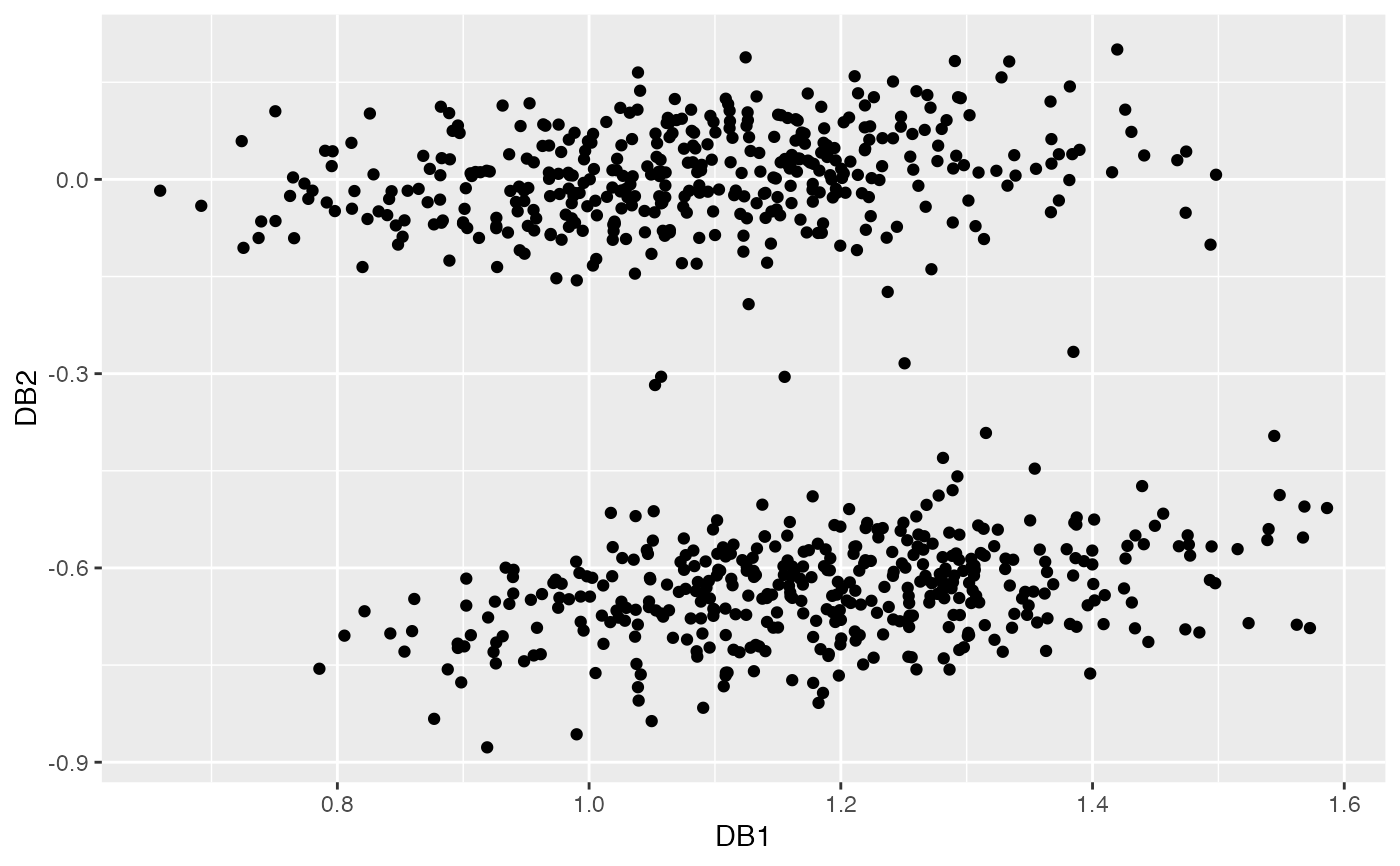
Examples
# A bimodal distribution in six dimensions, with 5 outliers in the middle.
set.seed(1)
x2 <- rnorm(405)
x3 <- rnorm(405)
x4 <- rnorm(405)
x5 <- rnorm(405)
x6 <- rnorm(405)
x1_1 <- rnorm(mean = 5, 400)
mu2 <-  0
x1_2 <- rnorm(5, mean=mu2, sd=0.2)
x1 <- c(x1_1, x1_2)
X1 <- cbind(x1,x2,x3,x4,x5,x6)
X2 <- cbind(-1*x1_1,x2[1:400],x3[1:400],x4[1:400],x5[1:400],x6[1:400])
X <- rbind(X1, X2)
labs <- c(rep(0,400), rep(1,5), rep(0,400))
dob <- dobin(X)
autoplot(dob)