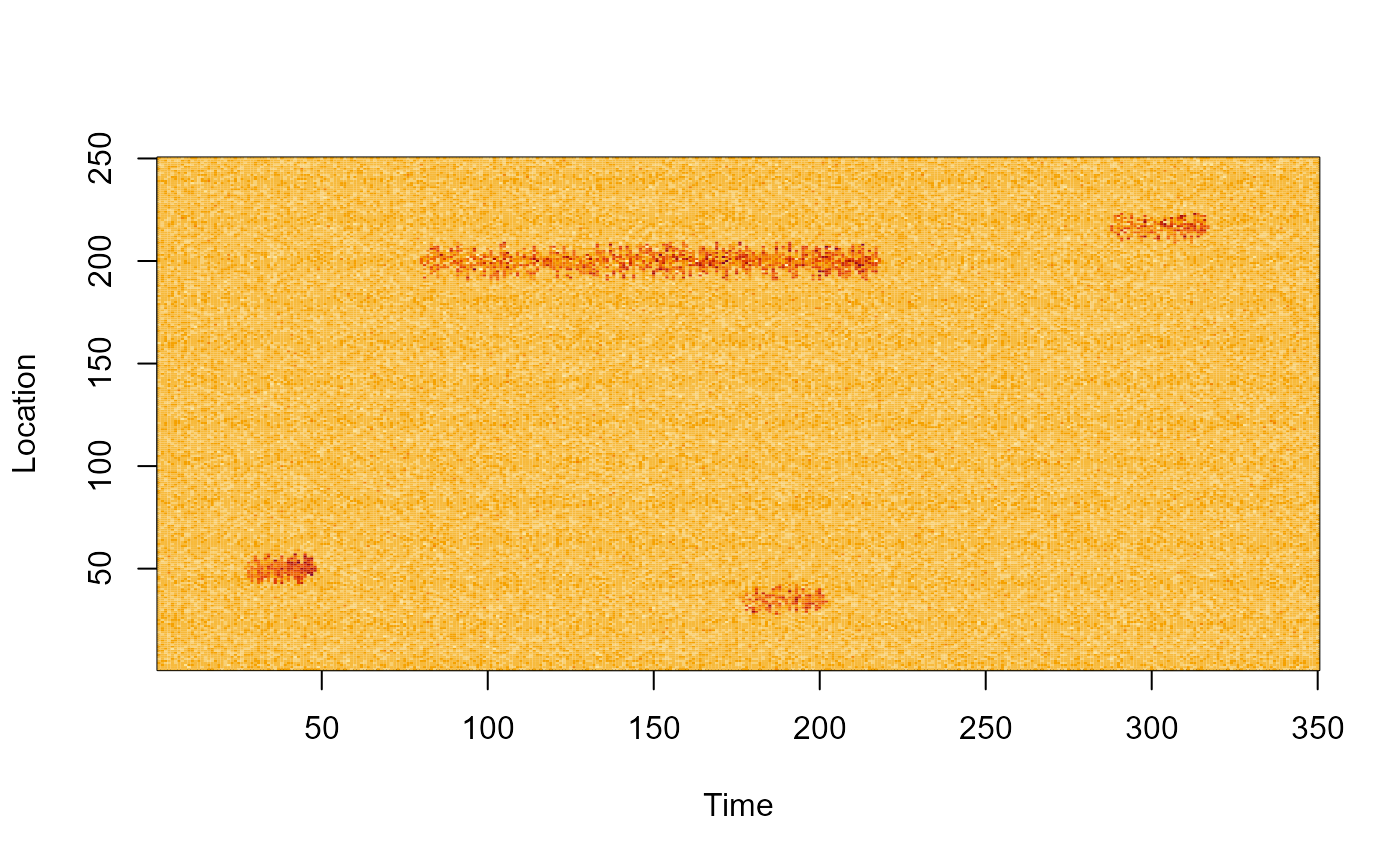
Generates a two dimensional data stream containing events of two classes.
gen_stream.RdThis function generates a two-dimensional data stream containing events of two classes. The data stream can be saved as separate files with images by specifying the argument folder.
Arguments
- n
The number of files to generate. Each file consists of a 350x250 data matrix.
- folder
If this is set to a local folder, the data matrices are saved in
folder/data, the images are saved infolder/picsand the event details are saved infolder/summary. The event details are needed to obtain the class labels of events, when event extraction is done.- sd
This specifies the seed.
- vis
If
TRUE, the images are plotted.- muAB
The starting event pixels of class A and B events are normally distributed with mean values specified by
muAB. The default isc(4,3).- sdAB
The starting standard deviations of class A and B events. Default set to
c(2,3).
Value
A list with following components:
dataThe data stream returned as a data frame.
detailsA data frame containing the details of the events: their positions, class labels, etc.. . This is needed for identifying class labels of events during event extraction.
eventlabsA matrix with 1 at event locations and 0 elsewhere.
Details
There are events of two classes in the data matrices : A and B. Events of class A have only one shape while events of class B have three different shapes, including class A's shape. This was motivated from a real world example. The details of events of each class are given below.
| Feature | class A | class B |
| Starting cell/pixel values | N(4,2) | N(3,3) |
| Ending cell/pixel values | N(8,2) | N(5,3) |
| Maximum age of event - shape 1 | U(20,30) | U(20,30) |
| Maximum age of event - shape 2 | NA | U(100,150) |
| Maximum age of event - shape 3 | NA | U(100,150) |
| Maximum width of event - shape 1 | U(20,26) | U(20,26) |
| Maximum width of event - shape 2 | NA | U(30,38) |
| Maximum width of event - shape 3 | NA | U(50,58) |