Performs CCA using Empirical Orthogonal Functions (EOFs) from a lagged dataset
cancor_eof.RdPerforms Canonical Correlation Analysis (CCA) using Empirical Orthogonal Function analysis using in a dataframe or a stars object. The autoplot function can plot the outputs.
The variations are * `cancor_eof.data.frame()` if the input is a dataframe * `cancor_eof.stars()` if the input is a stars object * `autoplot.cancoreof()` to plot the outputs.
Usage
cancor_eof(x, lag, n_eof, ...)

# S3 method for data.frame
cancor_eof(x, lag = 7, n_eof = 10, values_df, ...)

# S3 method for stars
cancor_eof(x, lag = 7, n_eof = 10, ...)

# S3 method for cancoreof
autoplot(
  object,
  line_plot = TRUE,
  space_plot = TRUE,
  palette = "Spectral",
  xlab = "Time",
  ...
)
Arguments
- x
The dataframe or stars object. If it is a dataframe, then it should have the locations.
- lag
Specifies the lag to be used.
- n_eof
The number of EOFs to be used.
- ...
Other arguments currently ignored.
- values_df
For dataframes: the dataframe of dimension
length(times) x length(locations)containing the quantity of interest.- object
autoplot parameter: the output of the function `cancor_eof'.
- line_plot
autoplot parameter: if set to
TRUE, then the line plot is included.- space_plot
autoplot parameter: if set to
TRUE, the space splot is included.- palette
autoplot parameter: the color palette to use for plotting.
- xlab
autoplot parameter:: he label on the x-axis for the line plot.
Examples
# Dataframe example
data(SSTlonlatshort)
data(SSTdatashort)
cancor_df <- cancor_eof(x = SSTlonlatshort,
lag = 7,
n_eof = 8,
values_df = SSTdatashort)
#> Canonical Correlation Analysis is carried out using a lagged dataset.
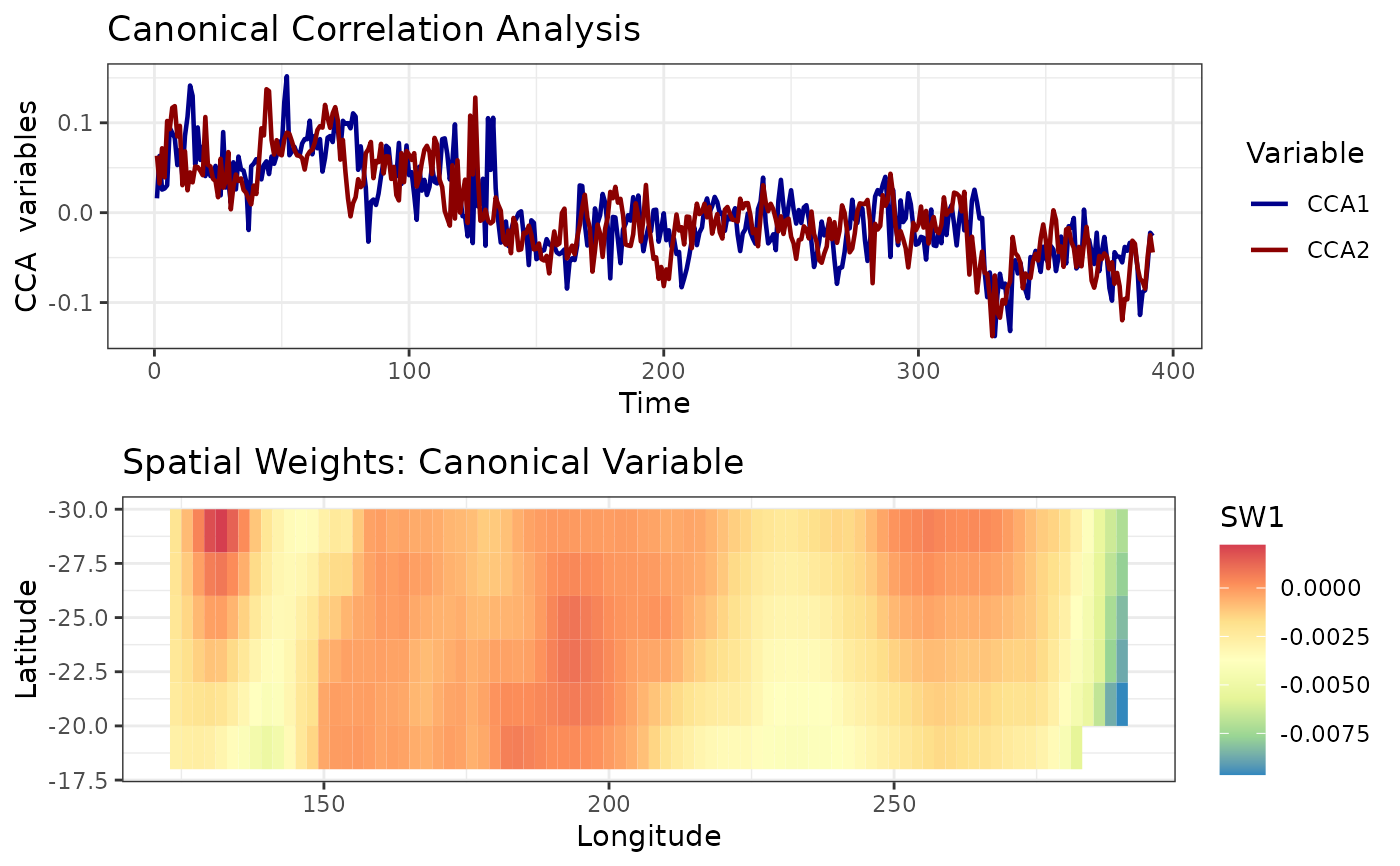
autoplot(cancor_df)
 # Stars example
library(dplyr)
#>
#> Attaching package: ‘dplyr’
#> The following objects are masked from ‘package:stats’:
#>
#> filter, lag
#> The following objects are masked from ‘package:base’:
#>
#> intersect, setdiff, setequal, union
library(stars)
#> Loading required package: abind
#> Loading required package: sf
#> Linking to GEOS 3.10.2, GDAL 3.4.1, PROJ 8.2.1; sf_use_s2() is TRUE
# Create a stars object from a data frame
precip_df <- NOAA_df_1990[NOAA_df_1990$proc == 'Precip', ] %>%
filter(date >= "1992-02-01" & date <= "1992-02-28")
precip <- precip_df[ ,c('lat', 'lon', 'date', 'z')]
st_precip <- st_as_stars(precip, dims = c("lon", "lat", "date"))
cancor_st <- cancor_eof(st_precip)
#> Canonical Correlation Analysis is carried out using a lagged dataset.
autoplot(cancor_st, line_plot = TRUE, space_plot = FALSE)
# Stars example
library(dplyr)
#>
#> Attaching package: ‘dplyr’
#> The following objects are masked from ‘package:stats’:
#>
#> filter, lag
#> The following objects are masked from ‘package:base’:
#>
#> intersect, setdiff, setequal, union
library(stars)
#> Loading required package: abind
#> Loading required package: sf
#> Linking to GEOS 3.10.2, GDAL 3.4.1, PROJ 8.2.1; sf_use_s2() is TRUE
# Create a stars object from a data frame
precip_df <- NOAA_df_1990[NOAA_df_1990$proc == 'Precip', ] %>%
filter(date >= "1992-02-01" & date <= "1992-02-28")
precip <- precip_df[ ,c('lat', 'lon', 'date', 'z')]
st_precip <- st_as_stars(precip, dims = c("lon", "lat", "date"))
cancor_st <- cancor_eof(st_precip)
#> Canonical Correlation Analysis is carried out using a lagged dataset.
autoplot(cancor_st, line_plot = TRUE, space_plot = FALSE)
