Computes empirical orthogonal functions using a dataframe or a stars object.
emp_orth_fun.RdComputes empirical orthogonal functions of the data. Function autoplot can plot the output.
Usage
emp_orth_fun(x, ...)

# S3 method for data.frame
emp_orth_fun(x, values_df, ...)

# S3 method for stars
emp_orth_fun(x, ...)

# S3 method for emporthfun
autoplot(
  object,
  EOF_num = 1,
  palette = "Spectral",
  only_EOF = FALSE,
  only_TS = FALSE,
  ...
)
Arguments
- x
The dataframe or stars object. If it is a dataframe, then it should have the locations.
- ...
Other arguments currently ignored.
- values_df
For dataframes: the dataframe of dimension
length(times) x length(locations)containing the quantity of interest.- object
For autoplot: the output of the function `emp_orth_fun'.
- EOF_num
For autoplot: the number of Empirical Orthogonal Functions (EOFs) to plot.
- palette
The color palette. Default is
Spectral.- only_EOF
For autoplot: if
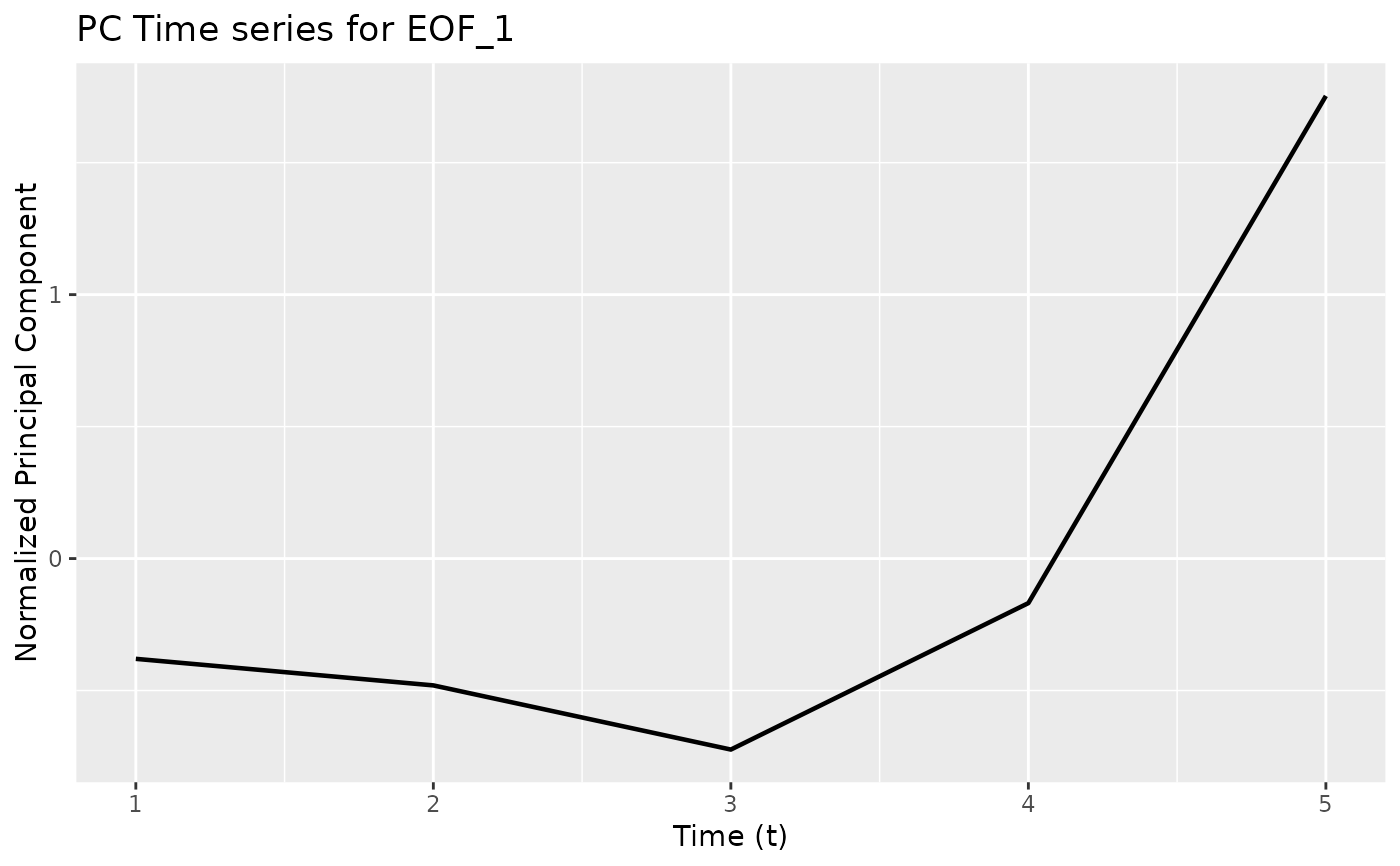
TRUE, only the spatial EOF function would be plotted.- only_TS
For autoplot: if
TRUE, only the PC time series would be plotted. If both are set toFALSE, both plots would be displayed. Both cannot be set toTRUE.
Examples
# dataframe example
data(SSTlonlatshort)
data(SSTdatashort)
data(SSTlandmaskshort)
delete_rows <- which(SSTlandmaskshort  ==  1)
SSTdatashort   <- SSTdatashort[-delete_rows, 1:396]
emp1 <- emp_orth_fun(SSTlonlatshort[-delete_rows,  ],
                     SSTdatashort)
autoplot(emp1,
         EOF_num = 1)


# stars example
library(dplyr)
library(stars)
# Create a stars object from a data frame
precip_df <- NOAA_df_1990[NOAA_df_1990$proc == 'Precip', ] %>%
  filter(date >= "1992-02-01" & date <= "1992-02-05")
precip <- precip_df[ ,c('lat', 'lon', 'date', 'z')]
st_precip <- st_as_stars(precip, dims = c("lon", "lat", "date"))
emp <- emp_orth_fun(st_precip)
autoplot(emp, only_TS = TRUE)
# stars example
library(dplyr)
library(stars)
# Create a stars object from a data frame
precip_df <- NOAA_df_1990[NOAA_df_1990$proc == 'Precip', ] %>%
filter(date >= "1992-02-01" & date <= "1992-02-05")
precip <- precip_df[ ,c('lat', 'lon', 'date', 'z')]
st_precip <- st_as_stars(precip, dims = c("lon", "lat", "date"))
emp <- emp_orth_fun(st_precip)
autoplot(emp, only_TS = TRUE)