Ridgeline plots grouped by an attribute using a dataframe as an input.
ridgeline.RdPlots ridgeline plots grouped by latitude/longitude or time. This function can take either a stars object or a dataframe. Input arguments differ for each case.
Usage
ridgeline(
  x,
  num_grps = 10,
  xlab = "Value",
  ylab = "Group Intervals",
  title = "",
  legend_title = "z",
  ...
)

# S3 method for data.frame
ridgeline(
  x,
  num_grps = 10,
  xlab = "Value",
  ylab = "Group Intervals",
  title = "",
  legend_title = "z",
  group_col,
  z_col,
  ...
)

# S3 method for stars
ridgeline(
  x,
  num_grps = 10,
  xlab = "Value",
  ylab = "Group Intervals",
  title = "",
  legend_title = "z",
  group_dim,
  ...
)
Arguments
- x
A stars object or a dataframe. Arguments differ according to the input type.
- num_grps
The number of levels for the ridgeline plot.
- xlab
The x label.
- ylab
The y label.
- title
The graph title.
- legend_title
The title for the legend.
- ...
Other arguments currently ignored.
- group_col
For dataframes: the column name of the group column.
- z_col
For dataframes: the The quantity of interest that will be plotted. Eg. temperature.
- group_dim
For stars objects: the dimension for the grouping variable.
Examples
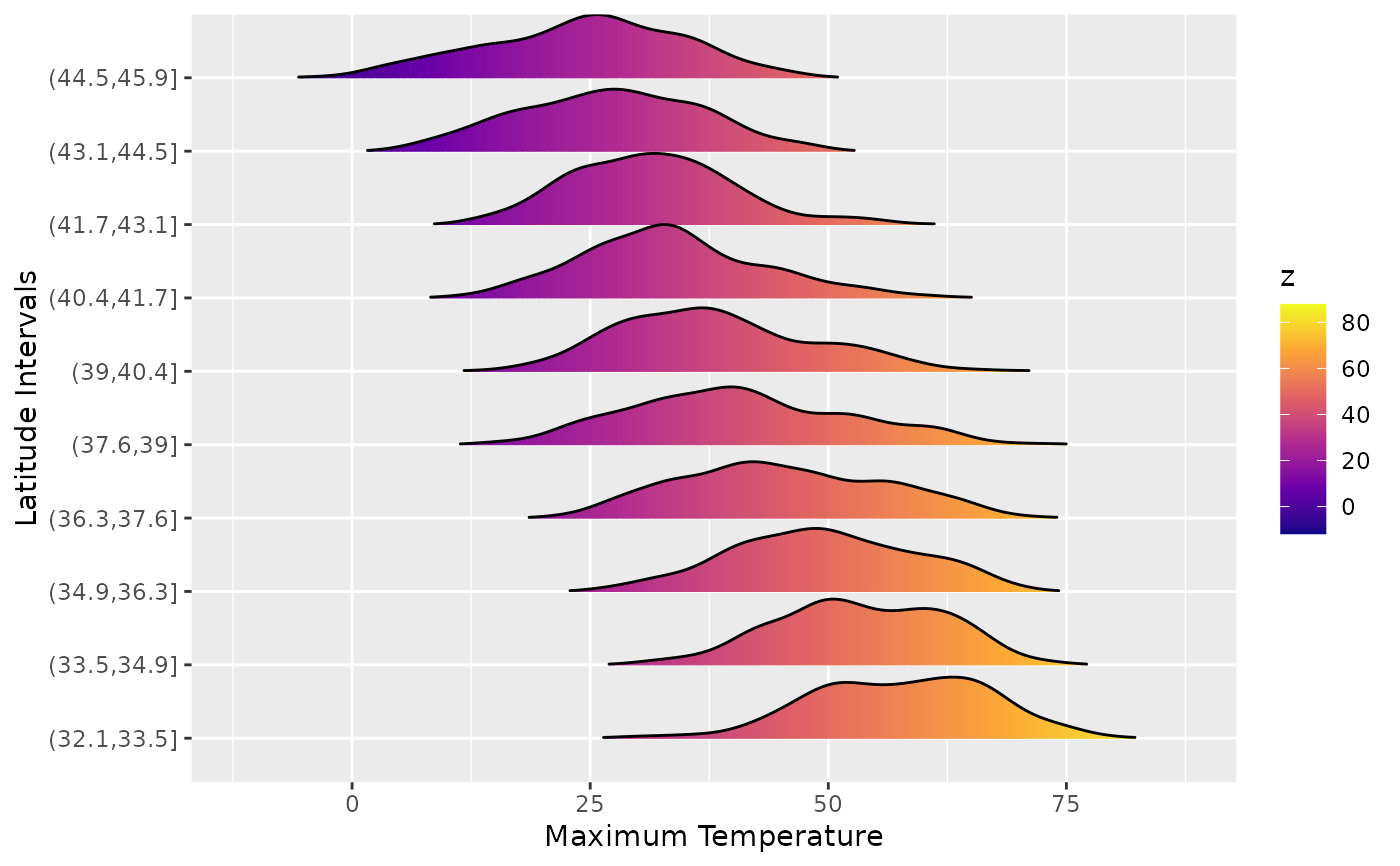
# Dataframe example
library(dplyr)
data(NOAA_df_1990)
TmaxJan <- filter(NOAA_df_1990,
proc == "Tmax" &
year == 1993 &
month == 1)
ridgeline(TmaxJan,
group_col = 'lat',
z_col = 'z',
xlab = 'Maximum Temperature',
ylab = 'Latitude Intervals')
#> Warning: `stat(x)` was deprecated in ggplot2 3.4.0.
#> ℹ Please use `after_stat(x)` instead.
#> ℹ The deprecated feature was likely used in the stxplore package.
#> Please report the issue to the authors.
#> Picking joint bandwidth of 2.62
 # stars examples
library(stars)
library(units)
#> udunits database from /usr/share/xml/udunits/udunits2.xml
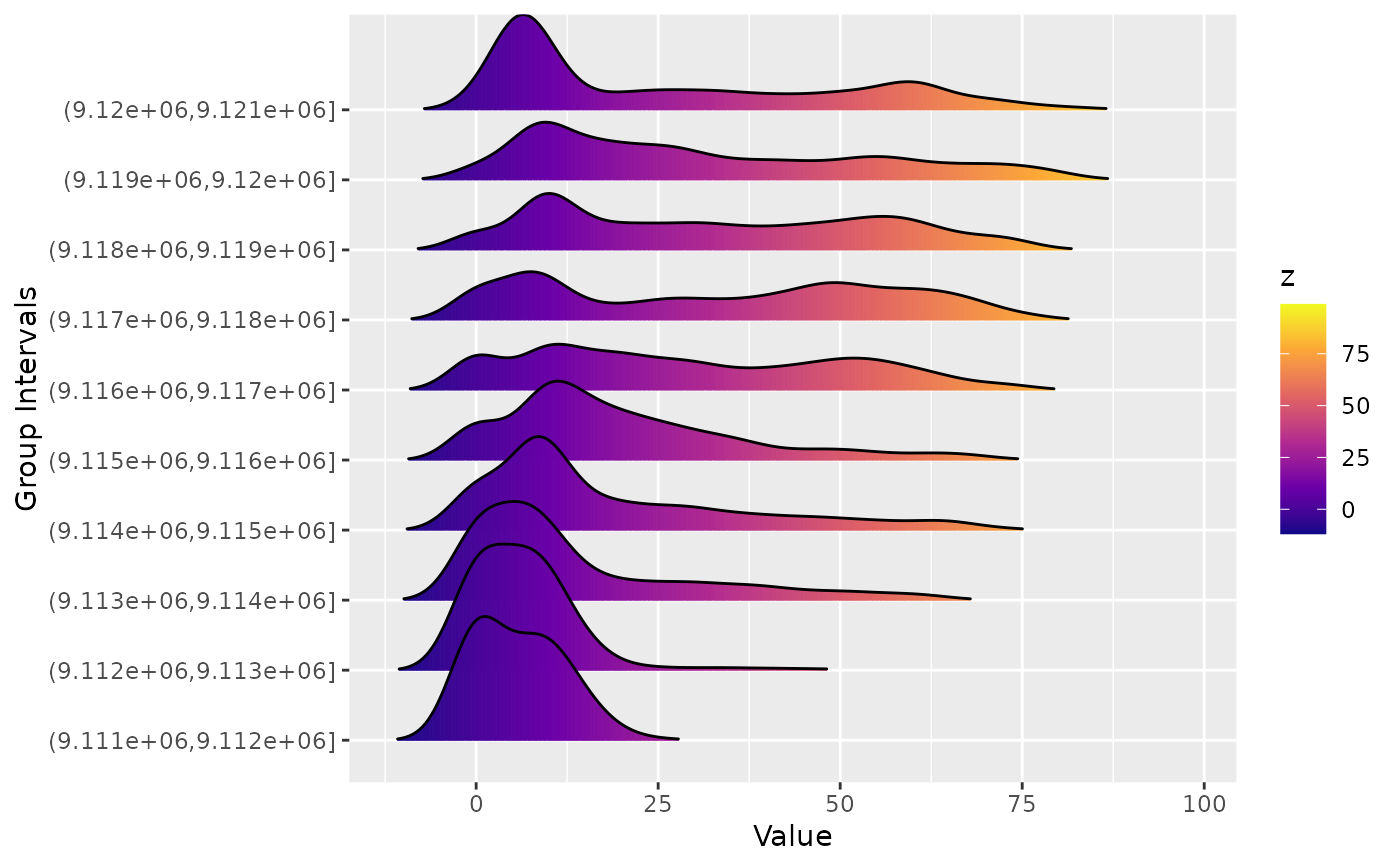
# stars Example 1
tif = system.file("tif/olinda_dem_utm25s.tif", package = "stars")
x <- read_stars(tif)
dim(x)
#> x y
#> 111 111
ridgeline(x, group_dim = 1)
#> Picking joint bandwidth of 3.15
# stars examples
library(stars)
library(units)
#> udunits database from /usr/share/xml/udunits/udunits2.xml
# stars Example 1
tif = system.file("tif/olinda_dem_utm25s.tif", package = "stars")
x <- read_stars(tif)
dim(x)
#> x y
#> 111 111
ridgeline(x, group_dim = 1)
#> Picking joint bandwidth of 3.15
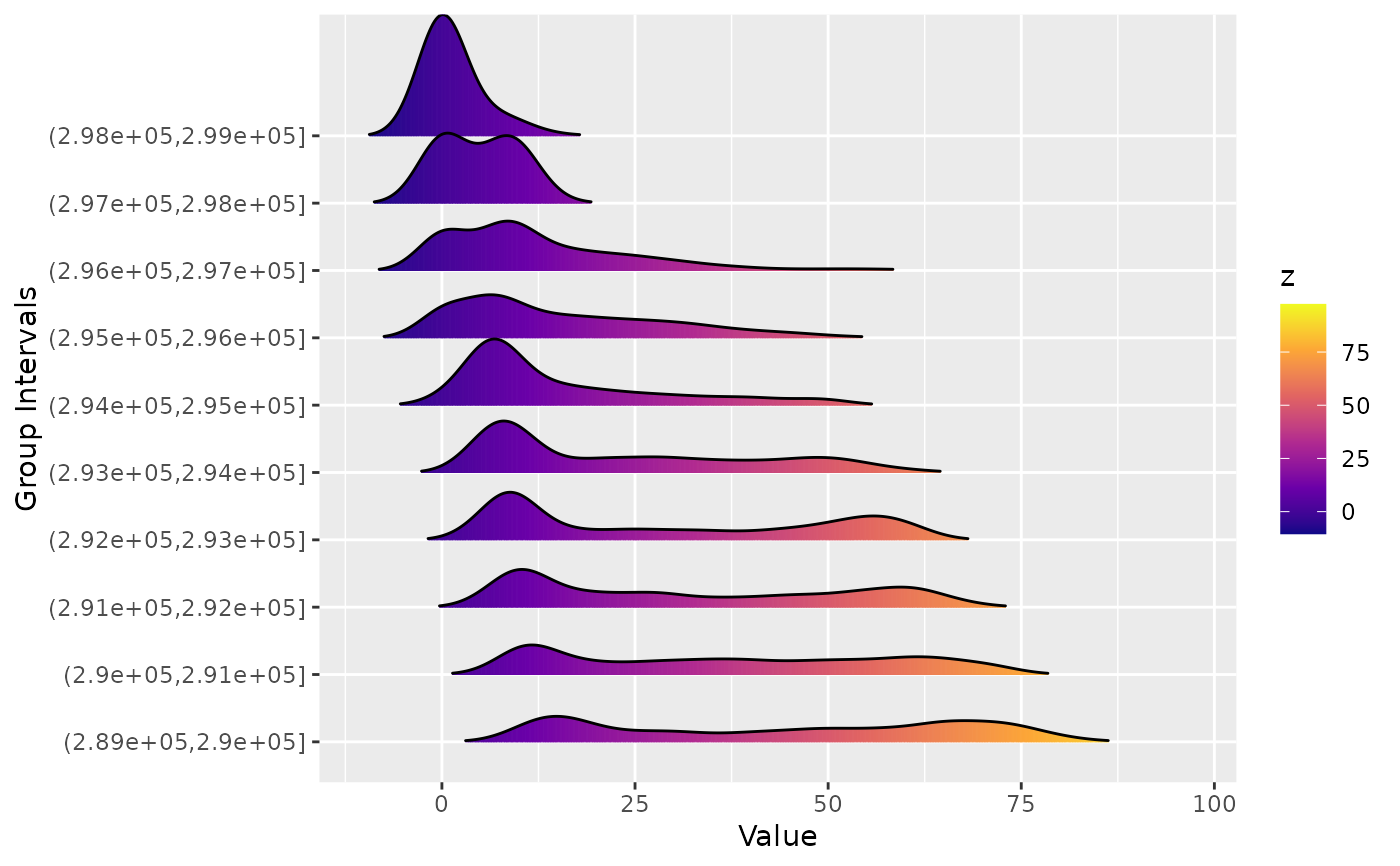 ridgeline(x, group_dim = 2)
#> Picking joint bandwidth of 3.63
ridgeline(x, group_dim = 2)
#> Picking joint bandwidth of 3.63
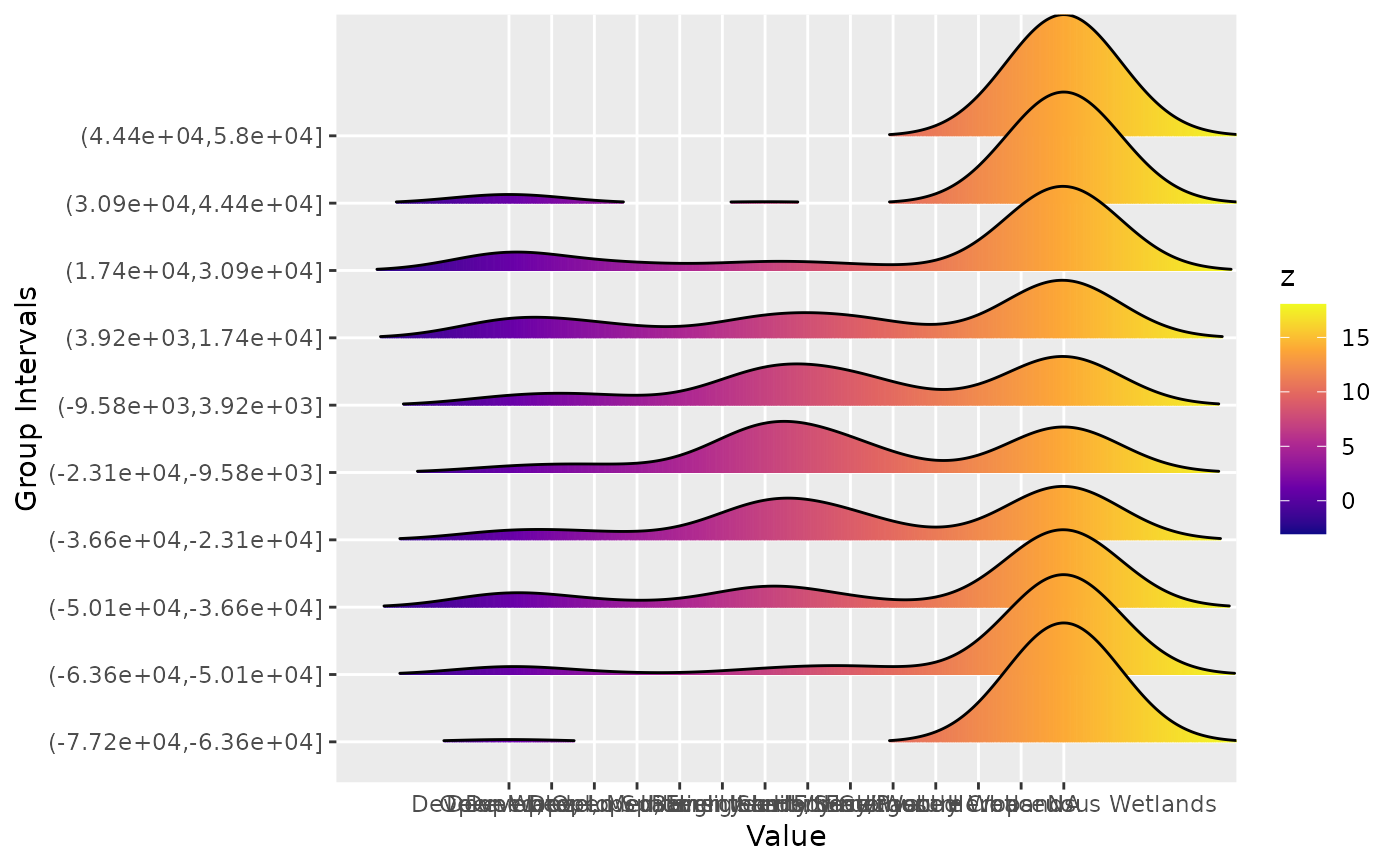
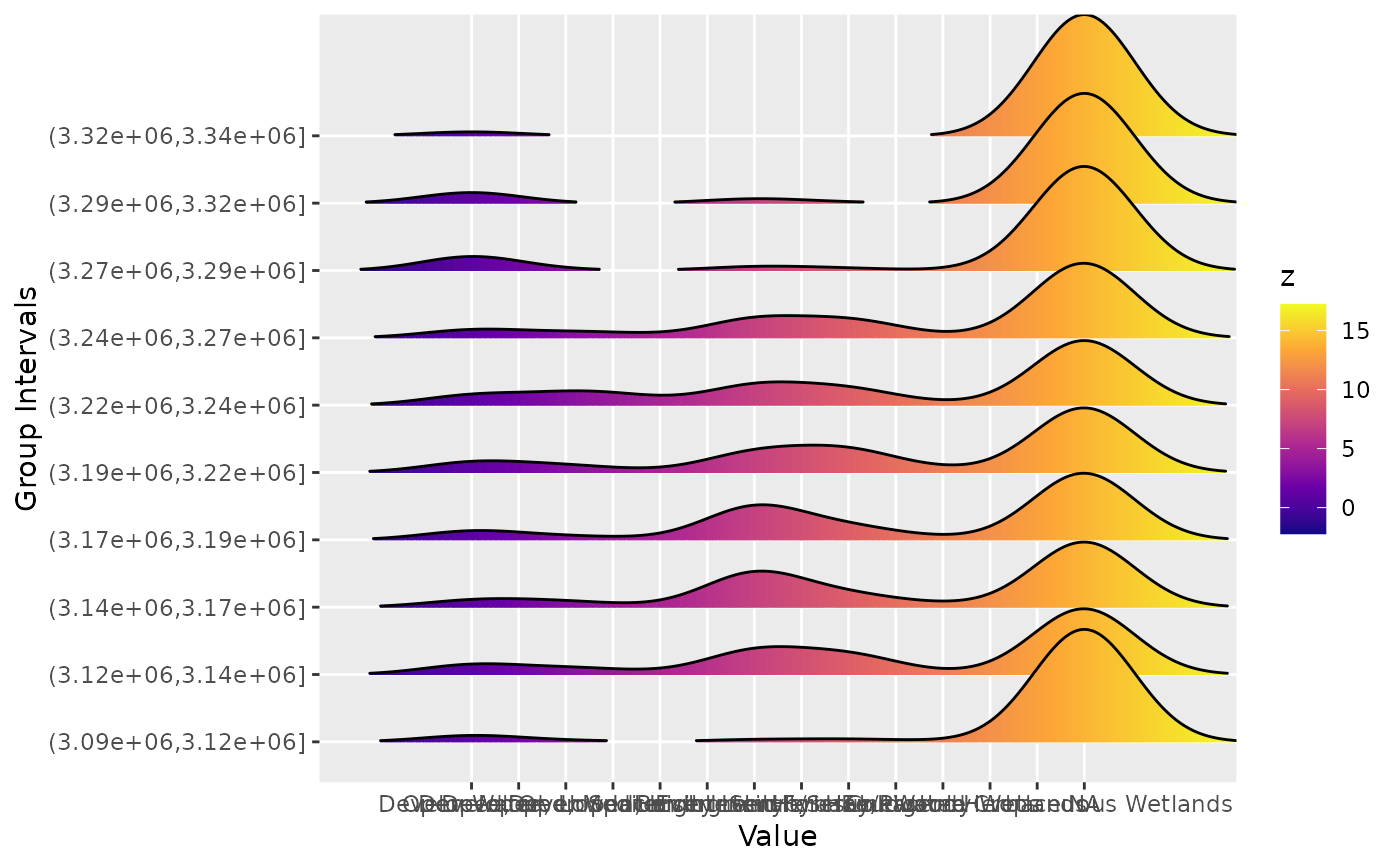
 # stars Example 2
tif = system.file("tif/lc.tif", package = "stars")
x <- read_stars(tif)
ridgeline(x, group_dim = 1)
#> Picking joint bandwidth of 1.08
# stars Example 2
tif = system.file("tif/lc.tif", package = "stars")
x <- read_stars(tif)
ridgeline(x, group_dim = 1)
#> Picking joint bandwidth of 1.08
 ridgeline(x, group_dim = 2)
#> Picking joint bandwidth of 1.35
ridgeline(x, group_dim = 2)
#> Picking joint bandwidth of 1.35