Computes spatial empirical means using a dataframe or a stars object
spatial_means.RdThis function computes spatial empirical means by latitude and longitude averaged over time. This function can take either a stars object or a dataframe. Input arguments differ for each case. The autoplot function can plot this object.
The variations are * 'spatial_means.data.frame()' if the input is a dataframe * 'spatial_means.stars()' if the input is a stars object * 'autoplot.spatialmeans()' to plot the outputs.
Usage
spatial_means(x, ...)

# S3 method for data.frame
spatial_means(x, lat_col, lon_col, t_col, z_col, ...)

# S3 method for stars
spatial_means(x, ...)

# S3 method for spatialmeans
autoplot(
  object,
  ylab = "Mean Value",
  xlab1 = "Latitude",
  xlab2 = "Longitude",
  title = "Spatial Empirical Means",
  ...
)
Arguments
- x
A stars object or a dataframe. Arguments differ according to the input type.
- ...
Other arguments currently ignored.
- lat_col
For dataframes: the column or the column name giving the latitude. The y coordinate can be used instead of latitude.
- lon_col
For dataframes: the column or the column name giving the longitude. The x coordinate can be used instead of longitude.
- t_col
For dataframes: the time column. Time must be a set of discrete integer values.
- z_col
For dataframes: the The quantity of interest that will be plotted. Eg. temperature.
- object
For autoplot: the output from the `spatial_means' function.
- ylab
For autoplot: the ylabel.
- xlab1
For autoplot: The xlabel for the first plot.
- xlab2
For autuoplot: The xlabel for the second plot.
- title
The graph title.
Examples
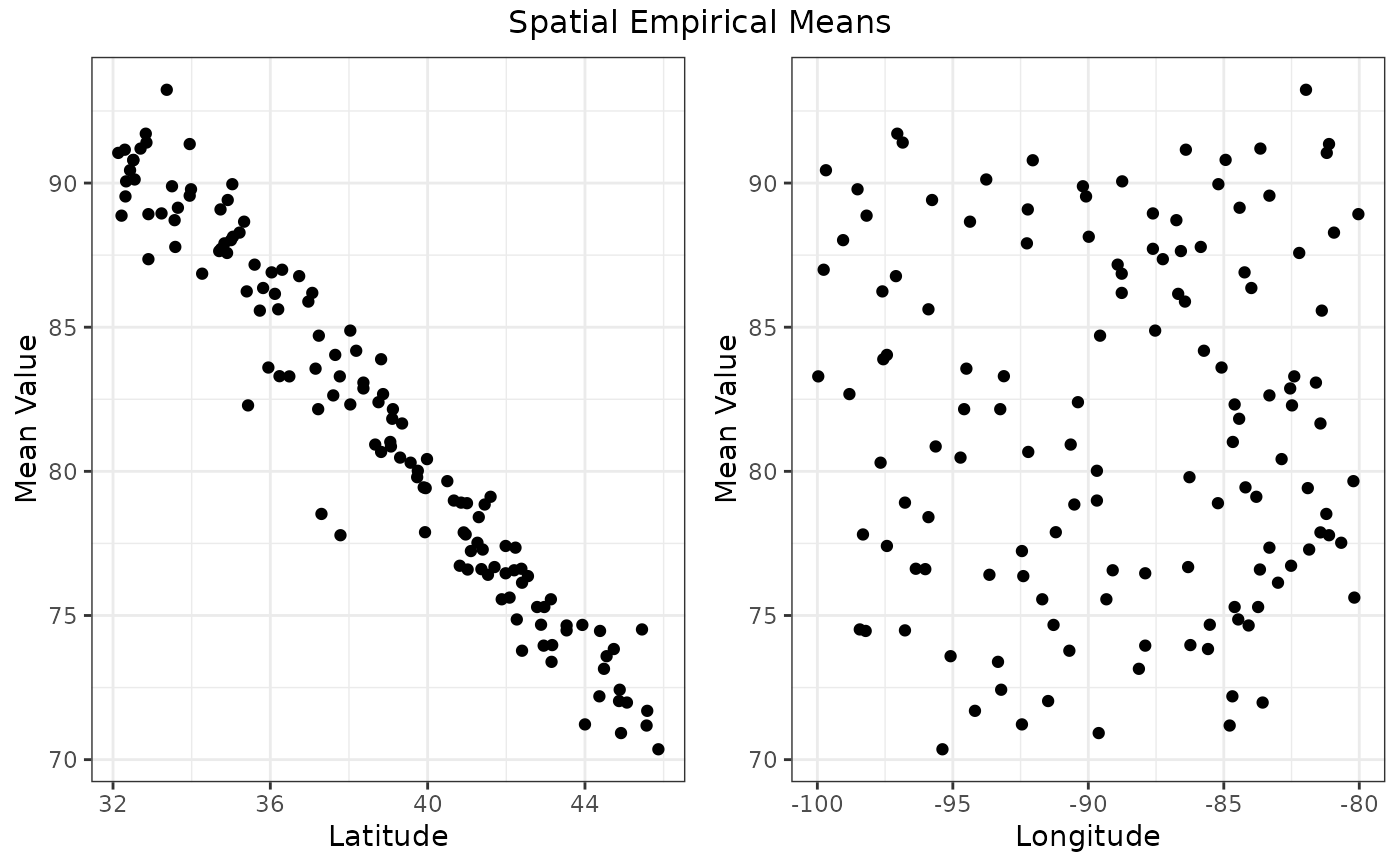
# dataframe example
data(NOAA_df_1990)
library(dplyr)
Tmax <- filter(NOAA_df_1990, # subset the data
proc == "Tmax" & # extract max temperature
month %in% 5:9 & # May to July
year == 1993) # year 1993
Tmax$t <- Tmax$julian - min(Tmax$julian) + 1 # create a new time variable starting at 1
sp_df <- spatial_means(Tmax,
lat_col = "lat",
lon_col = "lon",
t_col = "t",
z_col = "z")
autoplot(sp_df)
 #> TableGrob (2 x 2) "arrange": 3 grobs
#> z cells name grob
#> 1 1 (2-2,1-1) arrange gtable[layout]
#> 2 2 (2-2,2-2) arrange gtable[layout]
#> 3 3 (1-1,1-2) arrange text[GRID.text.1127]
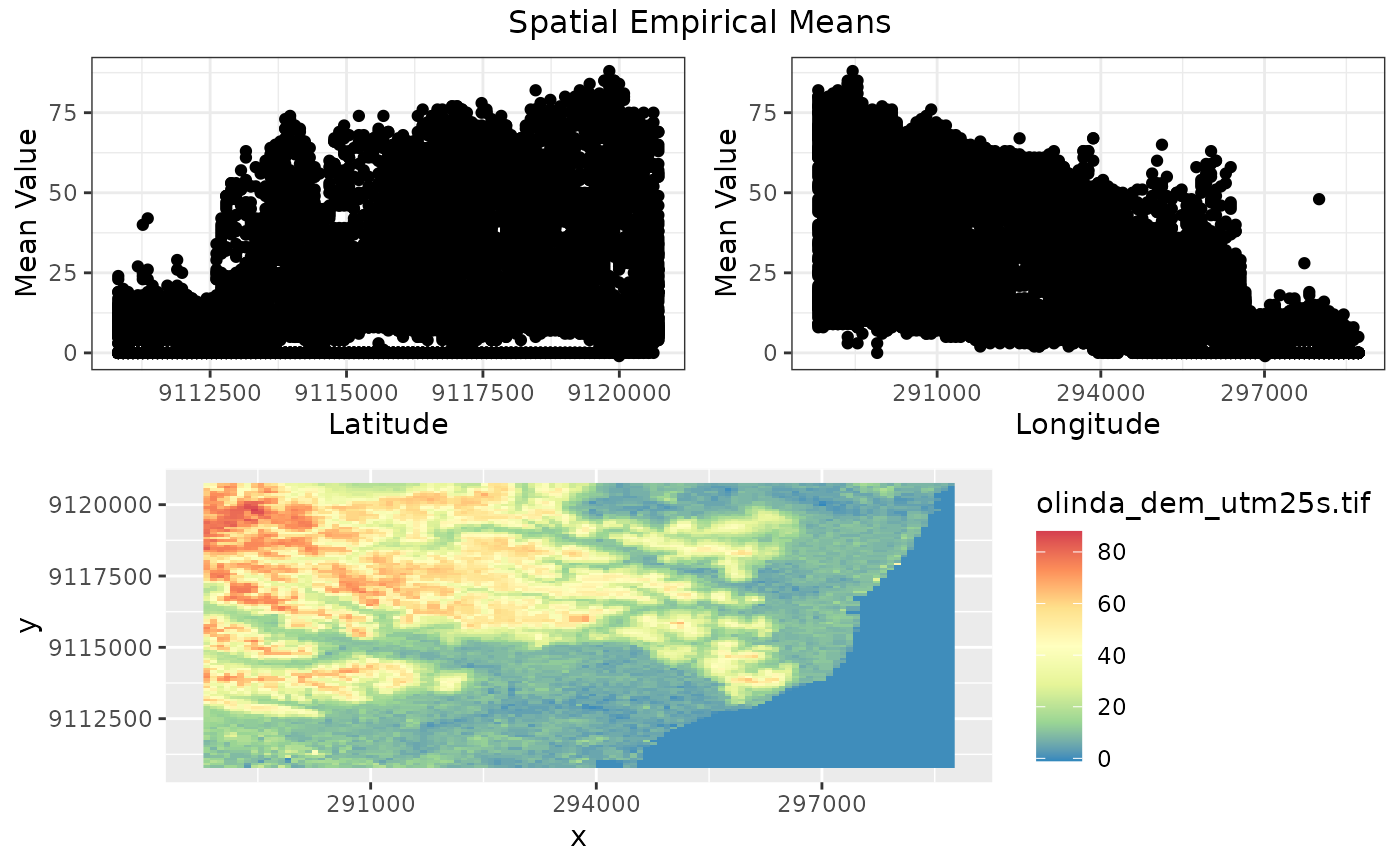
# stars examples
library(stars)
tif = system.file("tif/olinda_dem_utm25s.tif", package = "stars")
x <- read_stars(tif)
sp_means <- spatial_means(x)
#> Only one observation of each location is present. The mean is the original value itself!
autoplot(sp_means)
#> TableGrob (2 x 2) "arrange": 3 grobs
#> z cells name grob
#> 1 1 (2-2,1-1) arrange gtable[layout]
#> 2 2 (2-2,2-2) arrange gtable[layout]
#> 3 3 (1-1,1-2) arrange text[GRID.text.1127]
# stars examples
library(stars)
tif = system.file("tif/olinda_dem_utm25s.tif", package = "stars")
x <- read_stars(tif)
sp_means <- spatial_means(x)
#> Only one observation of each location is present. The mean is the original value itself!
autoplot(sp_means)
 #> TableGrob (3 x 2) "arrange": 4 grobs
#> z cells name grob
#> 1 1 (2-2,1-1) arrange gtable[layout]
#> 2 2 (2-2,2-2) arrange gtable[layout]
#> 3 3 (3-3,1-2) arrange gtable[layout]
#> 4 4 (1-1,1-2) arrange text[GRID.text.1251]
#> TableGrob (3 x 2) "arrange": 4 grobs
#> z cells name grob
#> 1 1 (2-2,1-1) arrange gtable[layout]
#> 2 2 (2-2,2-2) arrange gtable[layout]
#> 3 3 (3-3,1-2) arrange gtable[layout]
#> 4 4 (1-1,1-2) arrange text[GRID.text.1251]