Plots spatial snapshots of data through time using a dataframe or a stars object.
spatial_snapshots.RdThis function can take either a stars object or a dataframe. Input arguments differ for each case.
For dataframes, usage involves latitude and longitude. However, x and y coordinates can be given instead of longitude and latitude. If x and y are given instead of longitude and latitude, the country borders will not be shown.
Usage
spatial_snapshots(
  x,
  xlab = "x",
  ylab = "y",
  title = "",
  palette = "Spectral",
  legend_title = "z",
  ...
)

# S3 method for data.frame
spatial_snapshots(
  x,
  xlab = "Longitude",
  ylab = "Latitude",
  title = "",
  palette = "Spectral",
  legend_title = "z",
  lat_col,
  lon_col,
  t_col,
  z_col,
  ifxy = FALSE,
  ...
)

# S3 method for stars
spatial_snapshots(
  x,
  xlab = "x",
  ylab = "y",
  title = "",
  palette = "Spectral",
  legend_title = "z",
  ...
)
Arguments
- x
A stars object or a dataframe. Arguments differ according to the input type.
- xlab
The x label.
- ylab
The y label.
- title
The graph title.
- palette
The color palette. Default is
Spectral.- legend_title
The title for the legend.
- ...
Other arguments currently ignored.
- lat_col
For dataframes: the column or the column name giving the latitude. The y coordinate can be used instead of latitude.
- lon_col
For dataframes: the column or the column name giving the longitude. The x coordinate can be used instead of longitude.
- t_col
For dataframes: the time column. Time must be a set of discrete integer values.
- z_col
For dataframes: the The quantity of interest that will be plotted. Eg. temperature.
- ifxy
For dataframes: if
TRUEthen the country borders are not drawn as longitude and latitude are unknown.
Examples
library(dplyr)
# Dataframe example
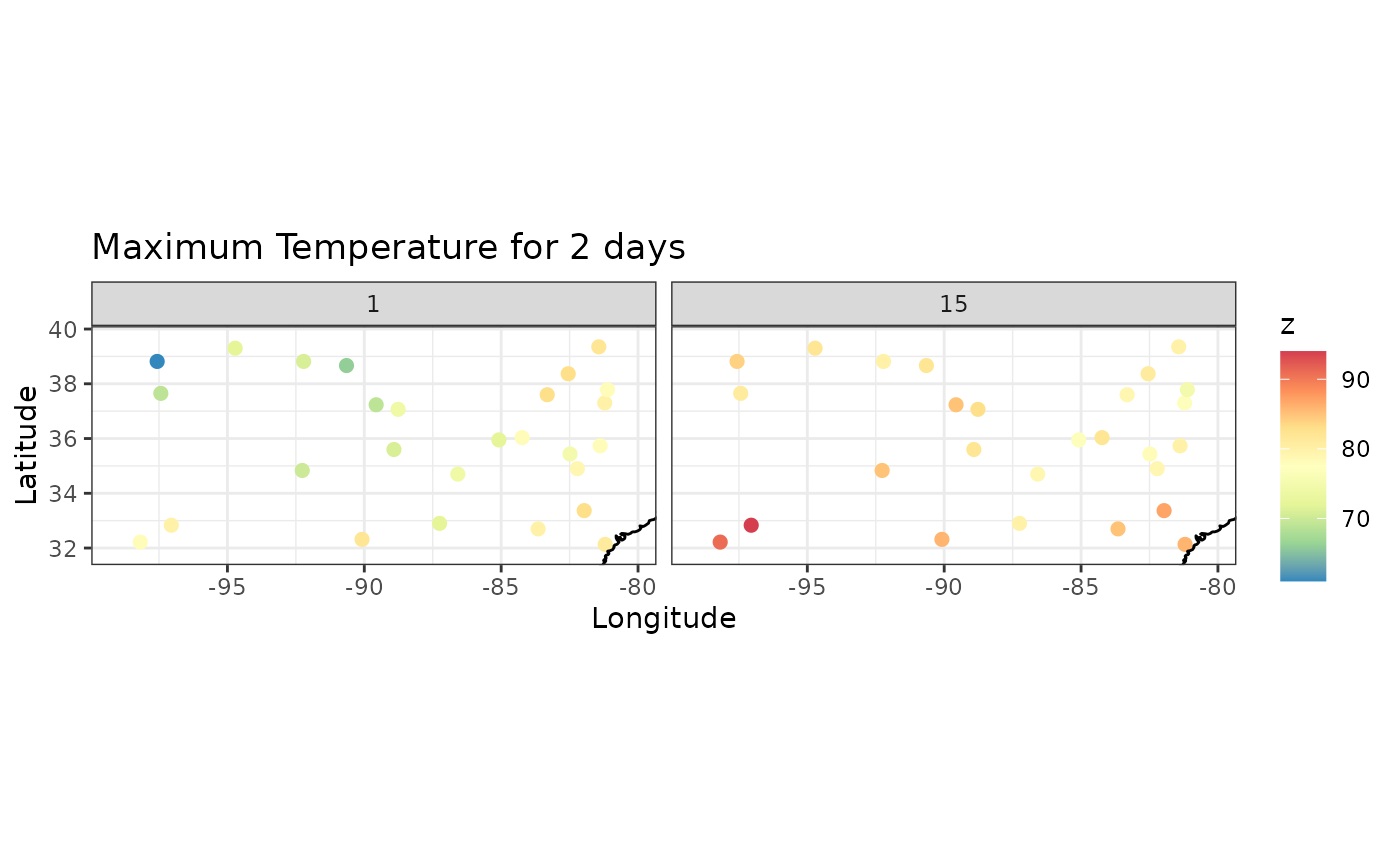
data(NOAA_df_1990)
Tmax <- filter(NOAA_df_1990,
proc == "Tmax" &
month == 5 &
year == 1993 &
id < 4000)
Tmax$t <- Tmax$julian - min(Tmax$julian) + 1
Tmax_days <- subset(Tmax, t %in% c(1, 15))
spatial_snapshots(Tmax_days,
lat_col = 'lat',
lon_col = 'lon',
t_col = 't',
z_col = 'z',
title = "Maximum Temperature for 2 days ")
 # stars example
library(stars)
tif = system.file("tif/L7_ETMs.tif", package = "stars")
x <- read_stars(tif)
x2 <- x %>% slice(band, 1:2)
spatial_snapshots(x2)
# stars example
library(stars)
tif = system.file("tif/L7_ETMs.tif", package = "stars")
x <- read_stars(tif)
x2 <- x %>% slice(band, 1:2)
spatial_snapshots(x2)
