Computes temporal empirical means using a dataframe or a stars object.
temporal_means.RdThis function computes temporal empirical means averaged per time unit. This function can take either a stars object or a dataframe. Input arguments differ for each case. The function autoplot plots the output.
Usage
temporal_means(x, ...)

# S3 method for data.frame
temporal_means(x, t_col, z_col, id_col, ...)

# S3 method for stars
temporal_means(x, ...)

# S3 method for temporalmeans
autoplot(
  object,
  ylab = "Value",
  xlab = "Time",
  legend_title = "",
  title = "Temporal Empirical Means",
  ...
)
Arguments
- x
A stars object or a dataframe. Arguments differ according to the input type.
- ...
Other arguments currently ignored.
- t_col
For dataframes: the time column. Time must be a set of discrete integer values.
- z_col
For dataframes: the The quantity of interest that will be plotted. Eg. temperature.
- id_col
The column of the location id.
- object
For autoplot: the output of the function `temporal_means'.
- ylab
The y label.
- xlab
The x label.
- legend_title
For autoplot: the title for the legend.
- title
The graph title.
Value
An object of class temporalmeans containing the averages and the original data in two dataframes.
Examples
# dataframe example
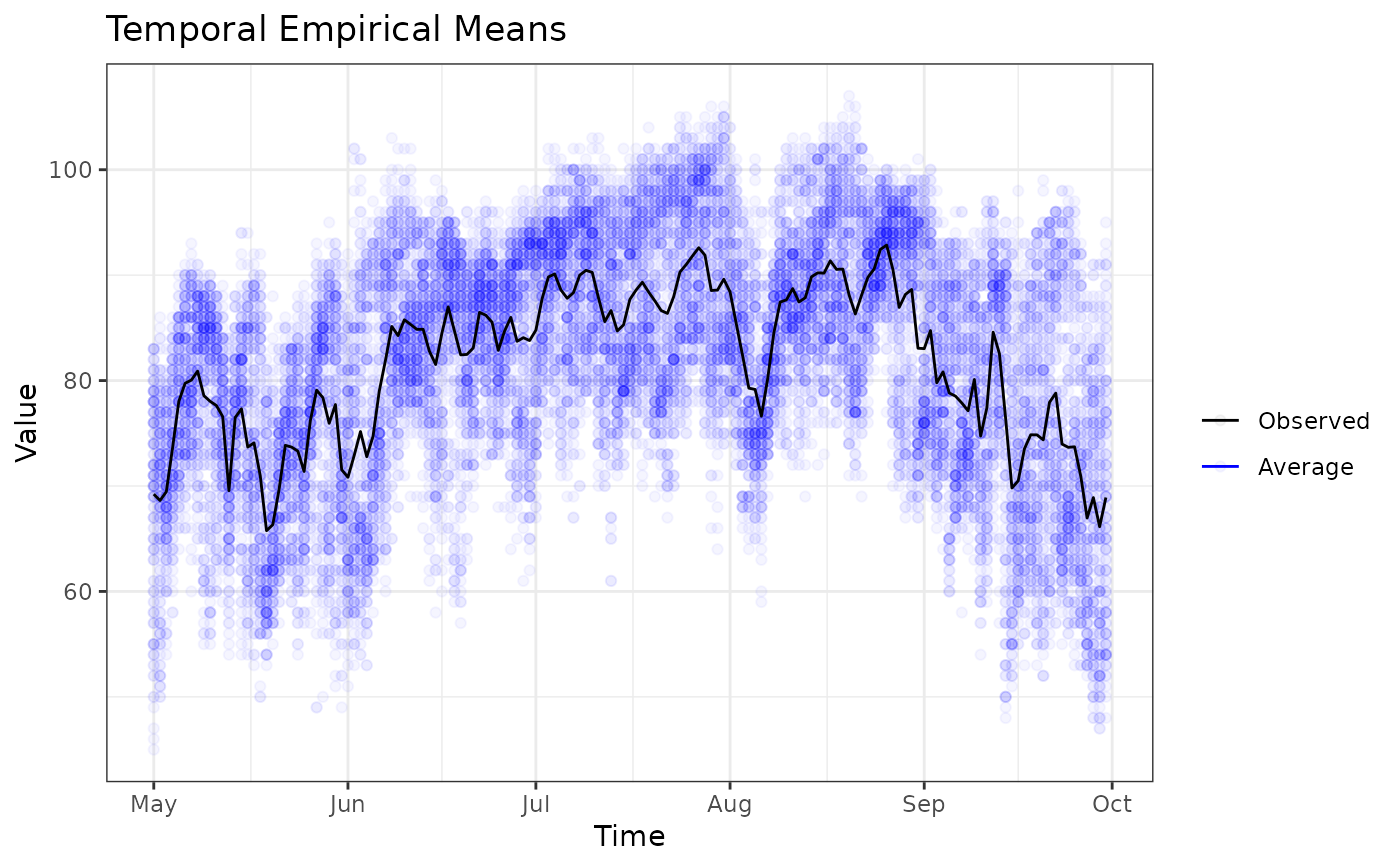
data(NOAA_df_1990)
library(dplyr)
Tmax <- filter(NOAA_df_1990, # subset the data
proc == "Tmax" & # extract max temperature
month %in% 5:9 & # May to July
year == 1993) # year 1993
Tmax$t <- Tmax$julian - min(Tmax$julian) + 1 # create a new time variable starting at 1
tem <- temporal_means(Tmax,
t_col = 'date',
z_col = 'z',
id_col = 'id')
autoplot(tem)
 # stars example
library(stars)
library(dplyr)
library(units)
# Example
prec_file = system.file("nc/test_stageiv_xyt.nc", package = "stars")
prec <- read_ncdf(prec_file)
#> no 'var' specified, using Total_precipitation_surface_1_Hour_Accumulation
#> other available variables:
#> lat, lon, time
#> Will return stars object with 236118 cells.
#> No projection information found in nc file.
#> Coordinate variable units found to be degrees,
#> assuming WGS84 Lat/Lon.
temporal_means(prec)
#> $data
#> # A tibble: 236,118 × 3
#> value time id
#> [kg/m^2] <dttm> <chr>
#> 1 0 2018-09-13 19:00:00 -80.6112976074219-33.781177520752
#> 2 0 2018-09-13 19:00:00 -80.5721740722656-33.7664184570312
#> 3 0 2018-09-13 19:00:00 -80.533073425293-33.7516403198242
#> 4 0 2018-09-13 19:00:00 -80.4939956665039-33.7368392944336
#> 5 0 2018-09-13 19:00:00 -80.4549407958984-33.7220191955566
#> 6 0 2018-09-13 19:00:00 -80.4159088134766-33.7071800231934
#> 7 0 2018-09-13 19:00:00 -80.3769073486328-33.6923217773438
#> 8 0 2018-09-13 19:00:00 -80.3379287719727-33.6774444580078
#> 9 0 2018-09-13 19:00:00 -80.2989730834961-33.6625442504883
#> 10 0 2018-09-13 19:00:00 -80.2600402832031-33.6476249694824
#> # ℹ 236,108 more rows
#>
#> $averages
#> # A tibble: 23 × 2
#> time meanz
#> <dttm> [kg/m^2]
#> 1 2018-09-13 19:00:00 2.40
#> 2 2018-09-13 20:00:00 2.79
#> 3 2018-09-13 21:00:00 2.30
#> 4 2018-09-13 22:00:00 2.05
#> 5 2018-09-13 23:00:00 3.21
#> 6 2018-09-14 00:00:00 4.35
#> 7 2018-09-14 01:00:00 3.57
#> 8 2018-09-14 02:00:00 4.11
#> 9 2018-09-14 03:00:00 3.84
#> 10 2018-09-14 04:00:00 4.96
#> # ℹ 13 more rows
#>
#> $call
#> temporal_means.stars(x = prec)
#>
#> attr(,"class")
#> [1] "temporalmeans"
# stars example
library(stars)
library(dplyr)
library(units)
# Example
prec_file = system.file("nc/test_stageiv_xyt.nc", package = "stars")
prec <- read_ncdf(prec_file)
#> no 'var' specified, using Total_precipitation_surface_1_Hour_Accumulation
#> other available variables:
#> lat, lon, time
#> Will return stars object with 236118 cells.
#> No projection information found in nc file.
#> Coordinate variable units found to be degrees,
#> assuming WGS84 Lat/Lon.
temporal_means(prec)
#> $data
#> # A tibble: 236,118 × 3
#> value time id
#> [kg/m^2] <dttm> <chr>
#> 1 0 2018-09-13 19:00:00 -80.6112976074219-33.781177520752
#> 2 0 2018-09-13 19:00:00 -80.5721740722656-33.7664184570312
#> 3 0 2018-09-13 19:00:00 -80.533073425293-33.7516403198242
#> 4 0 2018-09-13 19:00:00 -80.4939956665039-33.7368392944336
#> 5 0 2018-09-13 19:00:00 -80.4549407958984-33.7220191955566
#> 6 0 2018-09-13 19:00:00 -80.4159088134766-33.7071800231934
#> 7 0 2018-09-13 19:00:00 -80.3769073486328-33.6923217773438
#> 8 0 2018-09-13 19:00:00 -80.3379287719727-33.6774444580078
#> 9 0 2018-09-13 19:00:00 -80.2989730834961-33.6625442504883
#> 10 0 2018-09-13 19:00:00 -80.2600402832031-33.6476249694824
#> # ℹ 236,108 more rows
#>
#> $averages
#> # A tibble: 23 × 2
#> time meanz
#> <dttm> [kg/m^2]
#> 1 2018-09-13 19:00:00 2.40
#> 2 2018-09-13 20:00:00 2.79
#> 3 2018-09-13 21:00:00 2.30
#> 4 2018-09-13 22:00:00 2.05
#> 5 2018-09-13 23:00:00 3.21
#> 6 2018-09-14 00:00:00 4.35
#> 7 2018-09-14 01:00:00 3.57
#> 8 2018-09-14 02:00:00 4.11
#> 9 2018-09-14 03:00:00 3.84
#> 10 2018-09-14 04:00:00 4.96
#> # ℹ 13 more rows
#>
#> $call
#> temporal_means.stars(x = prec)
#>
#> attr(,"class")
#> [1] "temporalmeans"