Plots temporal snapshots of data for specific spatial locations using a dataframe or a stars object.
temporal_snapshots.RdThis function plots temporal snapshos for specific spatial locations. The location id sample need to be given as a function argument.
Usage
temporal_snapshots(x, xlab = "x", ylab = "y", title = "", ...)

# S3 method for data.frame
temporal_snapshots(
  x,
  xlab = "Time",
  ylab = "Value",
  title = "",
  t_col,
  z_col,
  id_col,
  id_sample,
  ...
)

# S3 method for stars
temporal_snapshots(
  x,
  xlab = "Time",
  ylab = "Value",
  title = "",
  xvals,
  yvals,
  precision = 0,
  ...
)
Arguments
- x
A stars object or a dataframe. Arguments differ according to the input type.
- xlab
The x label.
- ylab
The y label.
- title
The graph title.
- ...
Other arguments currently ignored.
- t_col
For dataframes: the time column. Time must be a set of discrete integer values.
- z_col
For dataframes: the The quantity of interest that will be plotted. Eg. temperature.
- id_col
The column of the location id.
- id_sample
The sample of location ids to be plotted
- xvals
For stars objects: the set of xvalues to plot.
- yvals
For stars objects: the set of yvalues to plot. These two lengths need to be the same.
- precision
For stars objects: set to 0, if the given values are compared with the integer values in the stars object.
Examples
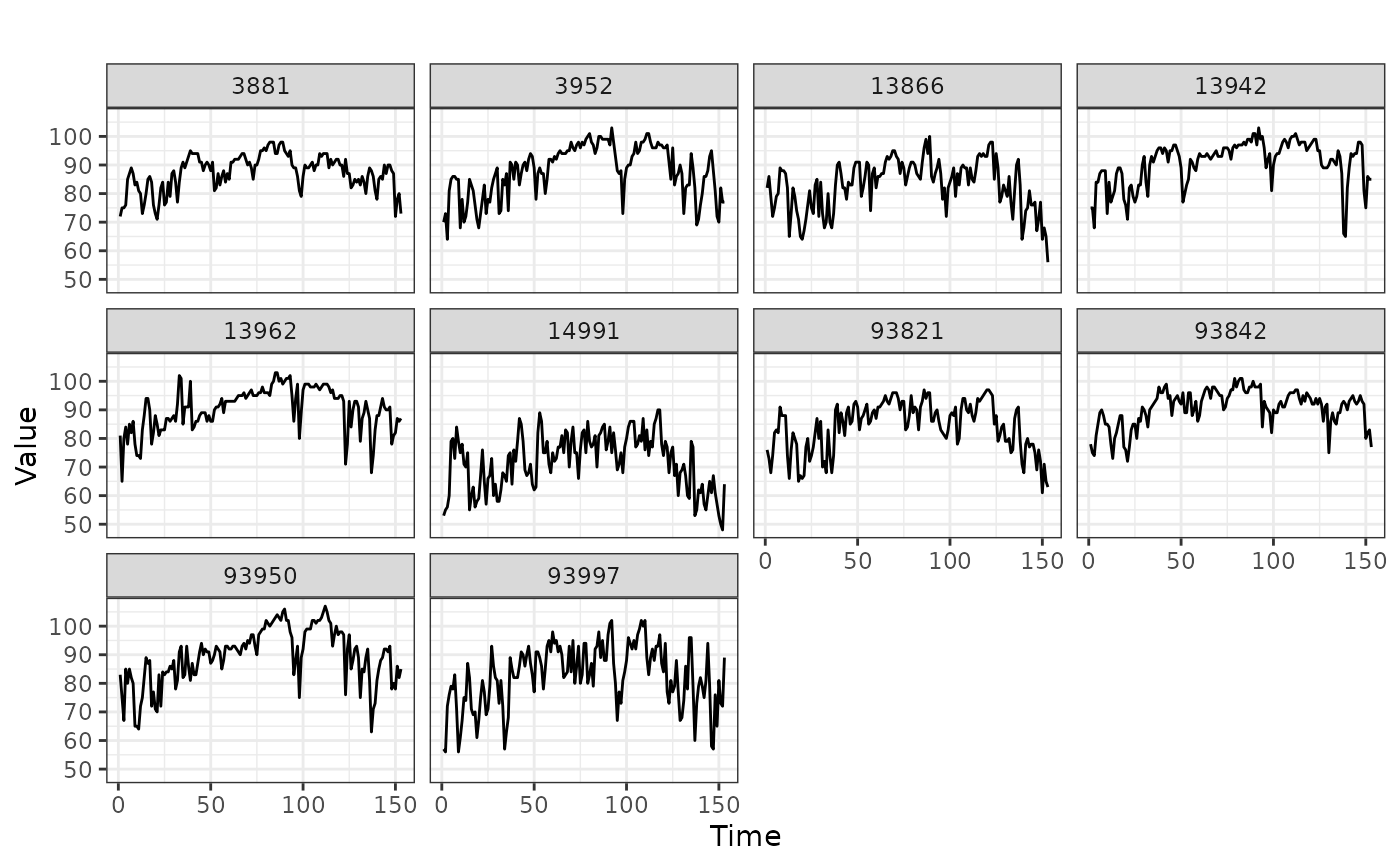
# Dataframe example
library(dplyr)
data(NOAA_df_1990)
Tmax <- filter(NOAA_df_1990,
proc == "Tmax" &
month %in% 5:9 &
year == 1993)
Tmax_ID <- unique(Tmax$id)
Tmax$t <- Tmax$julian - min(Tmax$julian) + 1
ids <- sample(Tmax_ID, 10)
temporal_snapshots(Tmax,
t_col = 't',
z_col = 'z',
id_col = 'id',
id_sample = ids)
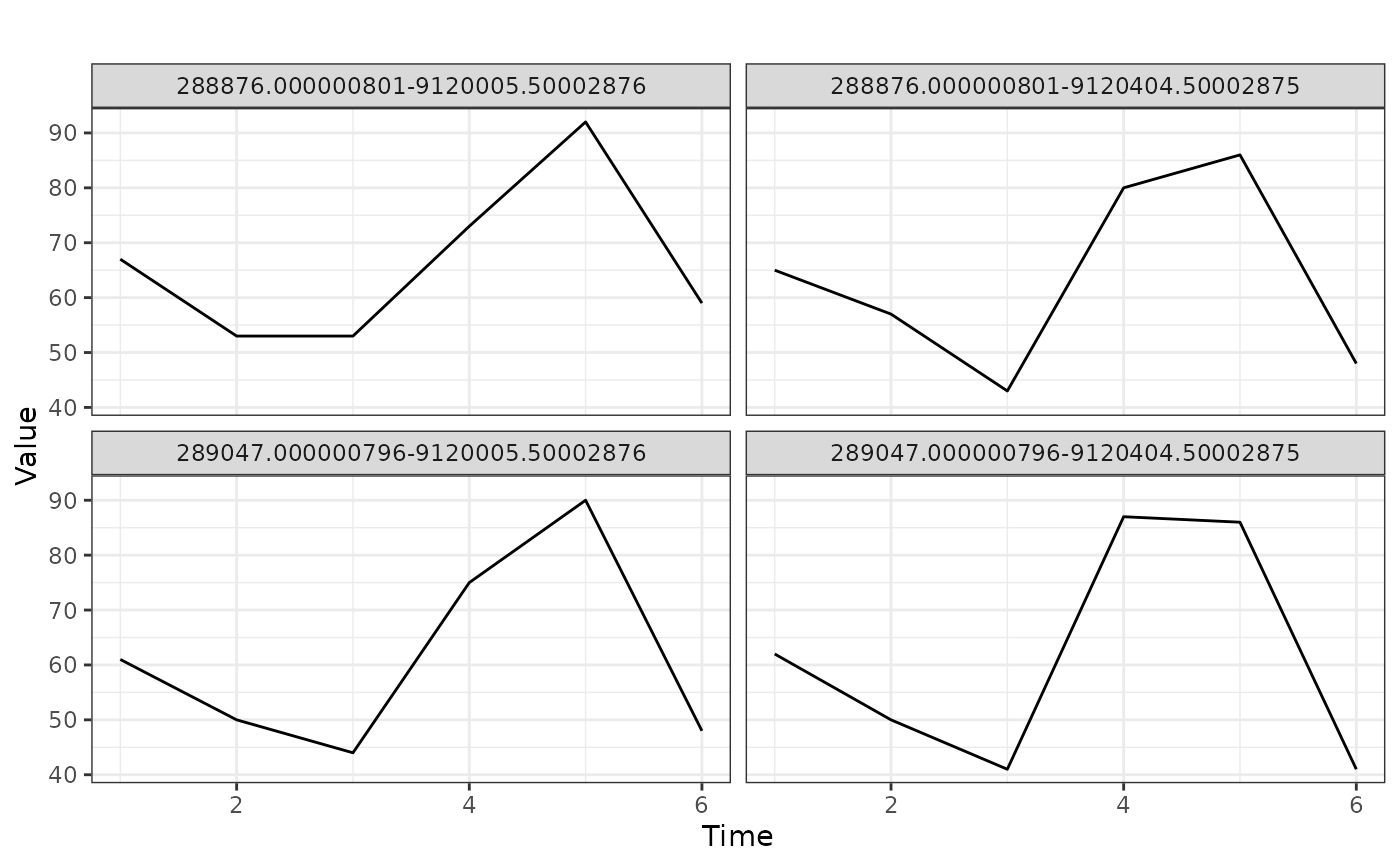
 # stars example
library(stars)
tif = system.file("tif/L7_ETMs.tif", package = "stars")
x <- read_stars(tif)
xvals <- c(288876.0,289047.0)
yvals <- c(9120405, 9120006)
temporal_snapshots(x,
xvals = xvals,
yvals = yvals)
# stars example
library(stars)
tif = system.file("tif/L7_ETMs.tif", package = "stars")
x <- read_stars(tif)
xvals <- c(288876.0,289047.0)
yvals <- c(9120405, 9120006)
temporal_snapshots(x,
xvals = xvals,
yvals = yvals)