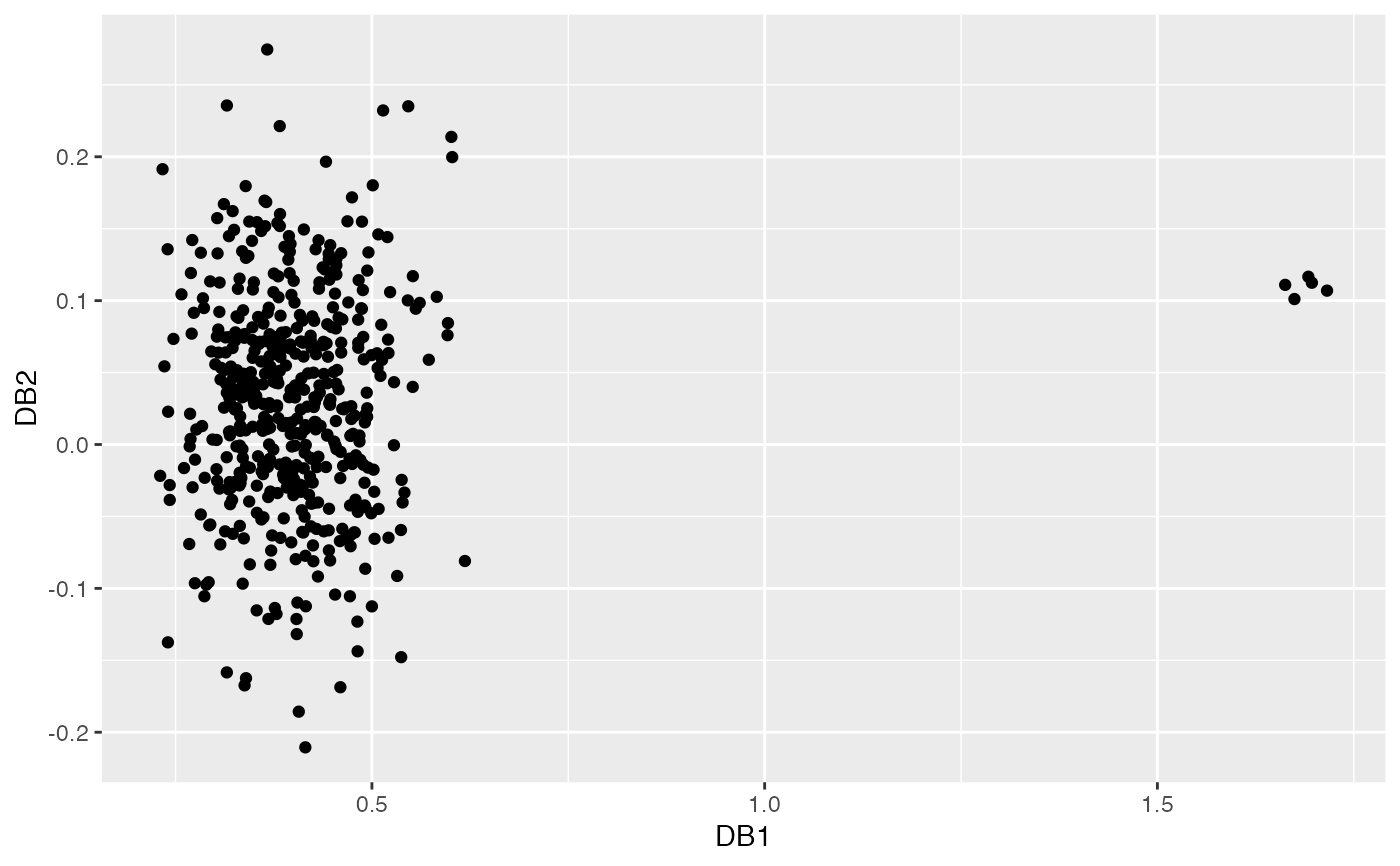
Plots the first two components of the dobin space.
autoplot.dobin.RdScatterplot of the first two columns in the dobin space.
# S3 method for dobin
autoplot(object, ...)
Arguments
- object
The output of the function `dobin`.
- ...
Other arguments currently ignored.
Value
A ggplot object.