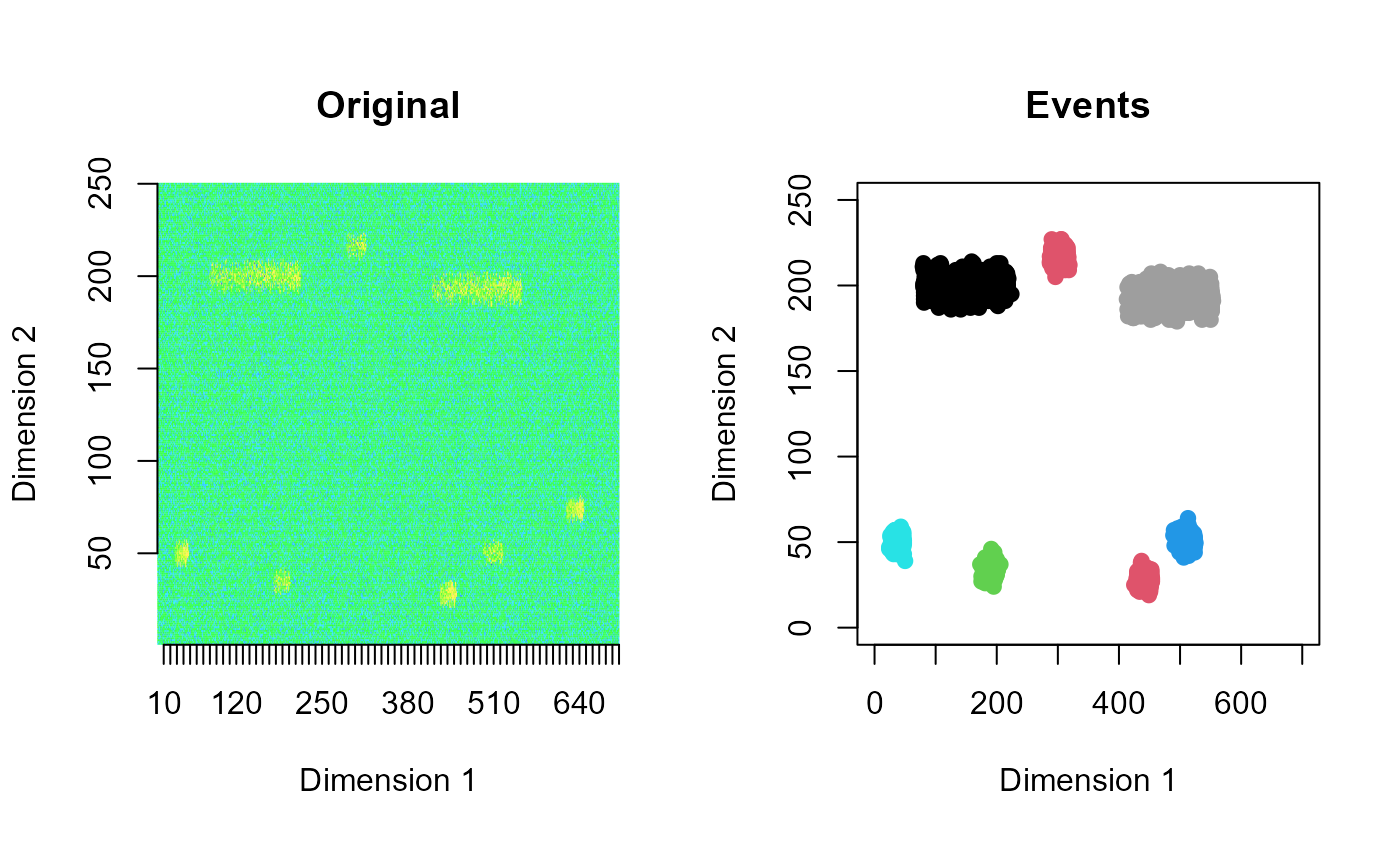
Extracts events from a two-dimensional data stream
get_clusters.RdThis function extracts events from a two-dimensional (1 spatial x 1 time) data stream.
get_clusters(
  dat,
  filename = NULL,
  thres = 0.95,
  vis = FALSE,
  epsilon = 5,
  miniPts = 10,
  rolling = TRUE
)
Arguments
- dat
The data matrix
- filename
If set, the figure of extracted events are saved in this name. The
filenameneeds to include the correct folder and file name.- thres
The cut-off quantile. Default is set to
0.95. Values greater than the quantile will be clustered. The rest is not clustered.- vis
If
TRUE, the window data and the extracted events are plotted for a 2D data stream.- epsilon
The
epsparameter indbscanfunction in the packagedbscan- miniPts
The
minPtsparameter indbscanfunction in the packagedbscan- rolling
This parameter is set to
TRUEif rolling windows are considered.
Value
A list with following components
clustersThe cluster assignment according to DBSCAN output.
dataThe data of this cluster assignment.
Examples
out <- gen_stream(2, sd=15)
zz <- as.matrix(out$data)
clst <- get_clusters(zz, vis=TRUE)