Computes background quantities using splines
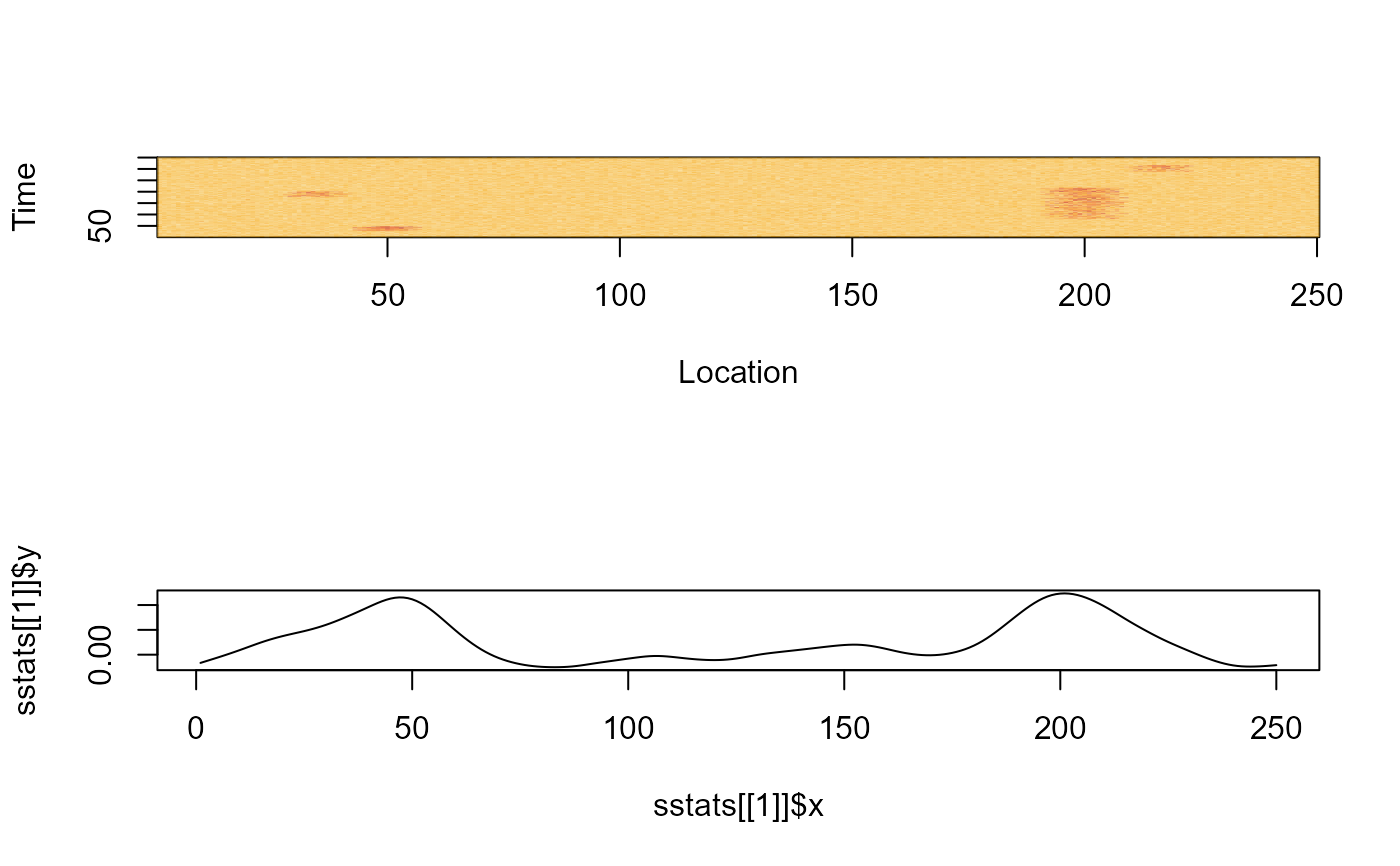
spline_stats.RdThis function computes 4 splines, from median, iqr, mean and standard deviation values.
spline_stats(dat)Arguments
- dat
The data matrix
Value
A list with following components
med.splineThe spline computed from the median values.
iqr.splineThe spline computed from IQR values.
mean.splineThe spline computed from mean values.
sd.splineThe spline computed from standard deviation values.
mean.datThe mean of the data matrix.
sd.datThe standard deviation of the data matrix.
