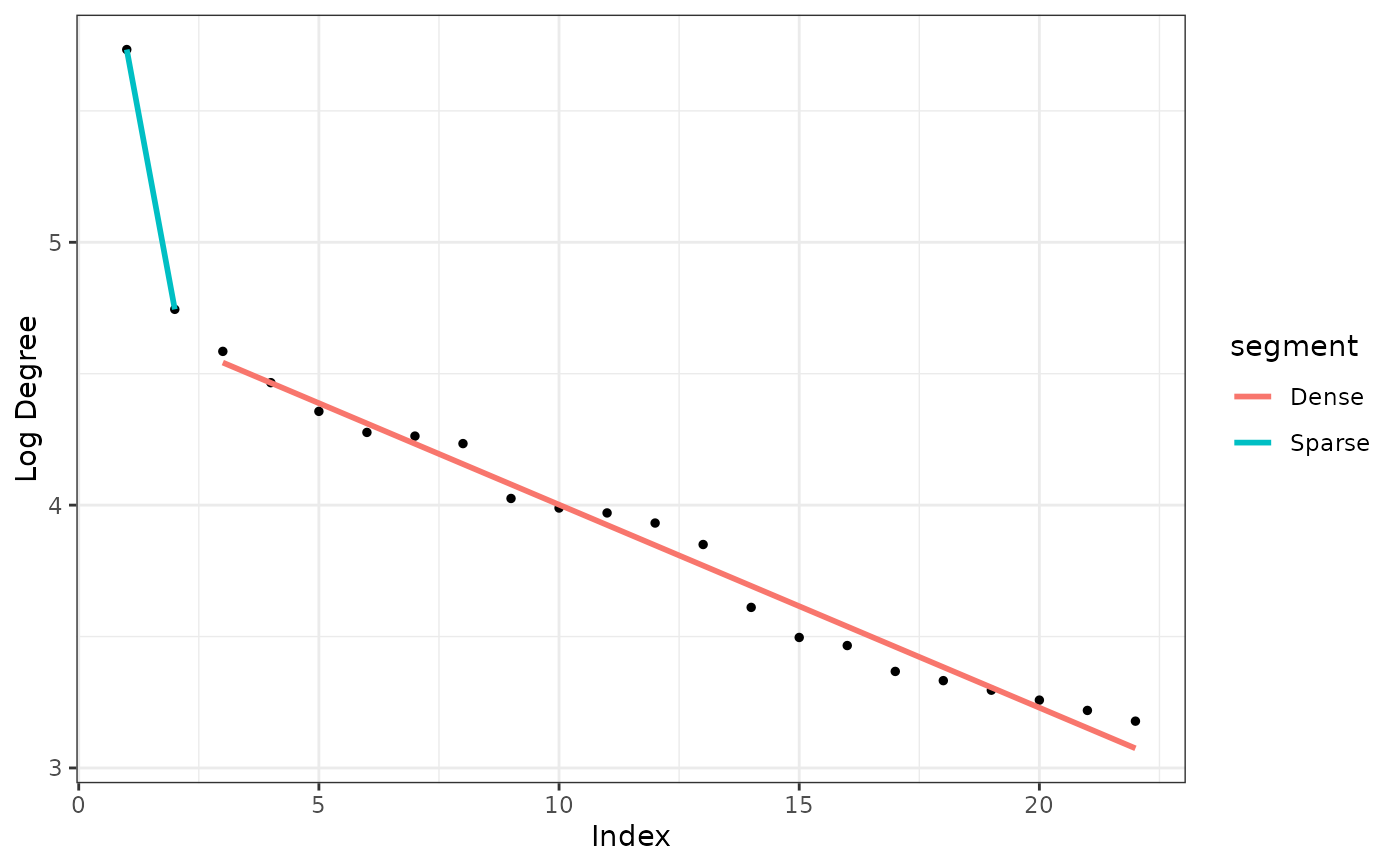
Plots the output of extract_sparse function.
autoplot.extract_sparse.RdPlots the two lines fitted to the unique, sorted log degrees of the graph.
Usage
# S3 method for class 'extract_sparse'
autoplot(object, ...)Examples
library(igraph)
#>
#> Attaching package: ‘igraph’
#> The following objects are masked from ‘package:stats’:
#>
#>     decompose, spectrum
#> The following object is masked from ‘package:base’:
#>
#>     union
gr <- sample_pa(10000, power = 1.2, directed = FALSE)
sparse <- extract_sparse(gr)
autoplot(sparse)
#> Warning: Using `size` aesthetic for lines was deprecated in ggplot2 3.4.0.
#> ℹ Please use `linewidth` instead.
#> ℹ The deprecated feature was likely used in the graphonmix package.
#>   Please report the issue to the authors.