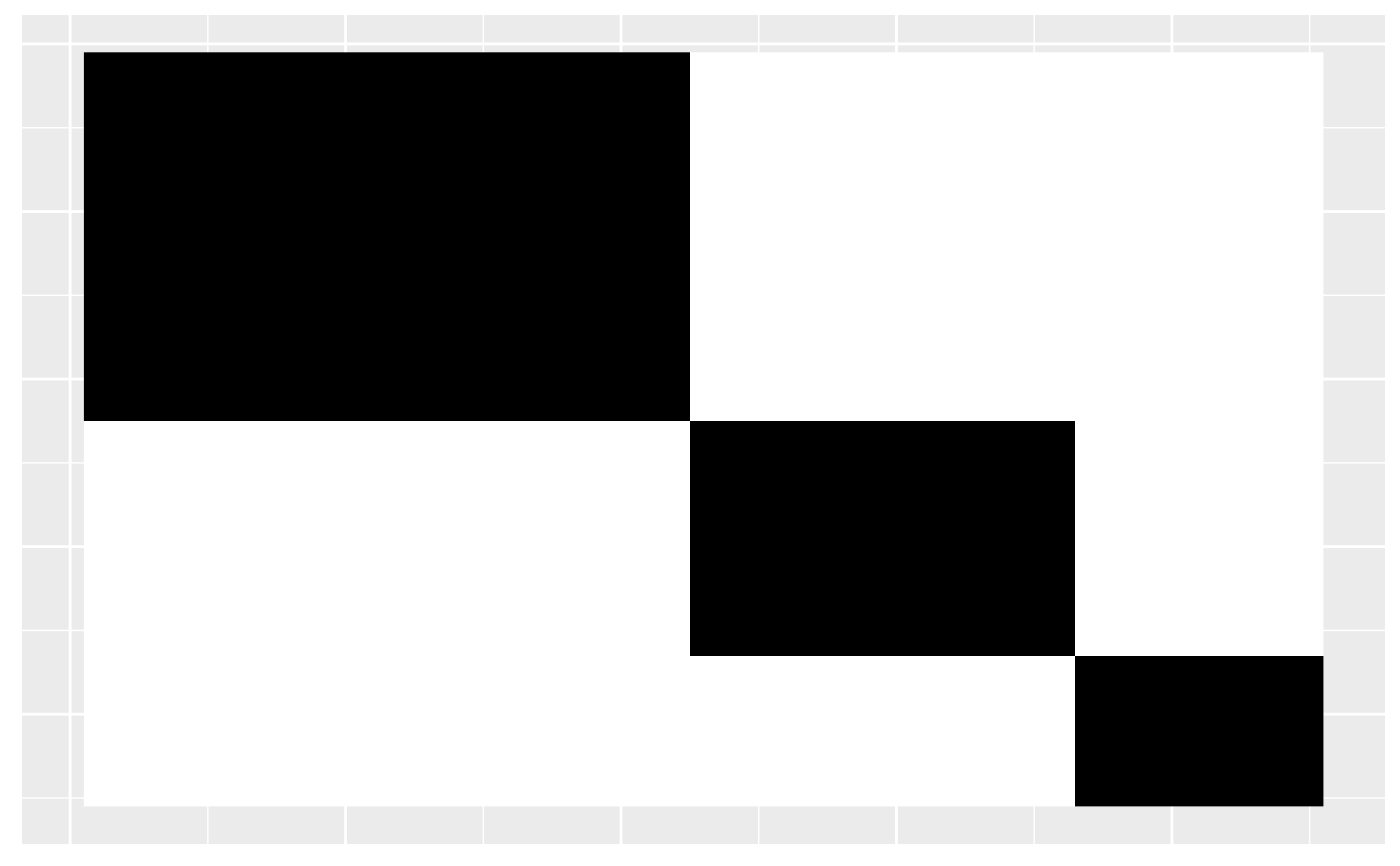
Creates a line graphon from a sequence of probabilities
line_graphon.RdCreates a line graphon, which is a disjoint clique graphon from a sequence of probability values
Examples
library(ggplot2)
wts <- c(0.5, 0.3, 0.2)
U <- line_graphon(wts)
plot_graphon(U)
