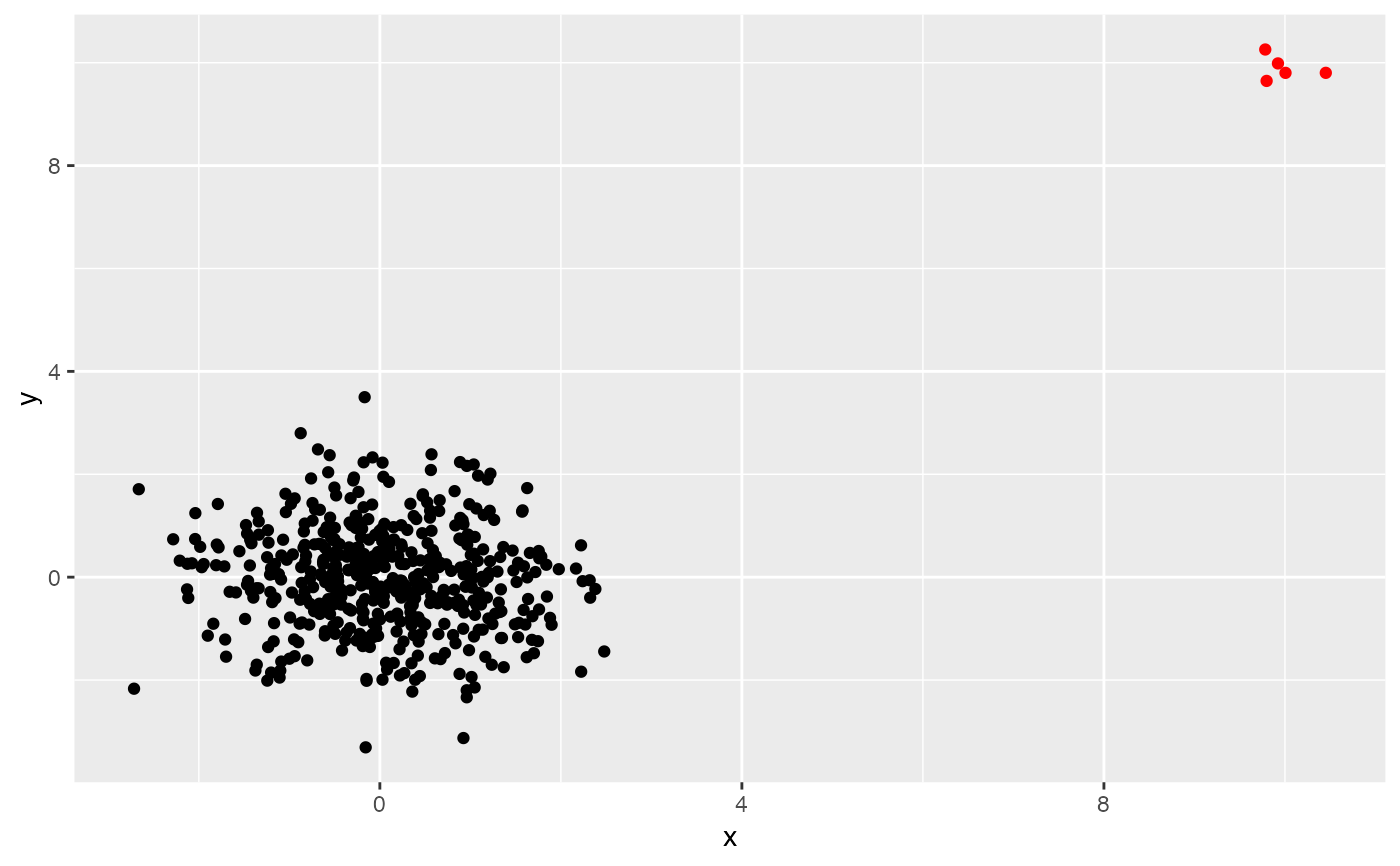
Plots outliers identified by lookout algorithm.
Source:R/autoplot_lookout.R
autoplot.lookoutliers.RdScatterplot of two columns from the data set with outliers highlighted.
Usage
# S3 method for class 'lookoutliers'
autoplot(object, columns = 1:2, ...)Examples
X <- rbind(
  data.frame(
    x = rnorm(500),
    y = rnorm(500)
  ),
  data.frame(
    x = rnorm(5, mean = 10, sd = 0.2),
    y = rnorm(5, mean = 10, sd = 0.2)
  )
)
lo <- lookout(X)
autoplot(lo)