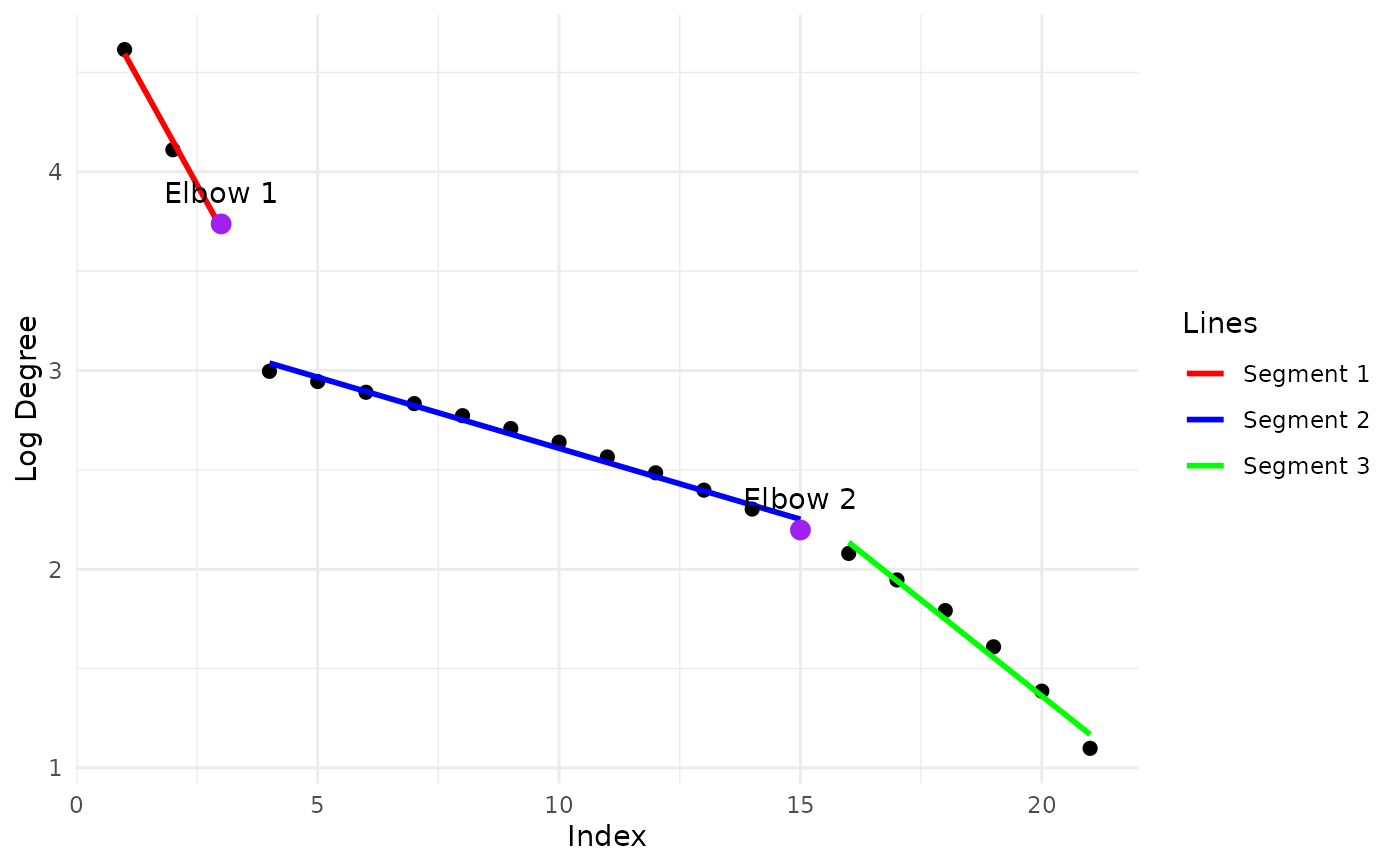
Plots the output of separate_dense_and_sparse.
autoplot.separate_dense_and_sparse.RdPlots the three lines fitted to the unique, sorted log degrees of the graph.
Usage
# S3 method for class 'separate_dense_and_sparse'
autoplot(object, ...)Examples
library(igraph)
W <- matrix(0.1, nrow = 100, ncol = 100)
wts <- c(0.5, 0.3, 0.2)
ns <- 200
nd <- 100
p <- 0.5
gr <- sample_mixed_graph(W, wts, nd, ns, p = 0.1, option = 2)
out <- separate_dense_and_sparse(gr)
separate <- separate_dense_and_sparse(gr)
autoplot(separate)